Contents
- 1 Reporting
- 2 Reporting > Supply-Only
- 3 Reporting > Supply+Install
- 4 Fascia-Gutter
- 5 Nett-Only
- 6 Drawings
- 7 Pay Rates
- 8 GRIM File Format
- 9 Report Templates – Microsoft Word/Excel
- 10 Report Templates – CAD
- 11 Reporting Key Text Strings
- 12 Data File Formats and Data Structures
Reporting
 The reporting stage is where you generate the material and labour (if required) summaries. Once the pricing details have been checked, it is here that you select the reports that you need to generate and print from the huge amount of detail automatically created by the Roof Wizard estimating process.

Extracting the vast amount of information that Roof Wizard generates requires you to have the report templates defined to display this information. Initially, this may be seen as a complex process, but once mastered, it is awesomely powerful in extracting and providing information to all parties – from suppliers to installers and everyone on between.
Note – The primary difference between Supply Only and Supply and Install is that Supply and Install includes installation labour costs. The description of both sections below should be read and understood.
 Reporting > Supply-Only
When you select Supply-Only, all the materials are tallied, sorted and displayed on the Supply-Only dialog box. The title on the dialog box describes the name of the current quote as well as what page is displayed.

In calculating the material and labour items required, the software pauses to check if any EXTRA items have been defined that are set with the [Prompted] option (refer to set of EXTRA items for details). If any are found, then the dialog box is displayed showing all items setup to be prompted for, prior to finalising the quotation. Select the required items for this job and click OK. If multiple items need to be selected, hold down the CTRL key and select all requried items in the list.

This process allows you to add items, labour or material, that may be required on a job, but not a function of the roof size or type. It can include all sorts of additional costs that must be included in the job quotation.
The Reporting for the job takes account of stages defined using Stage Manager such as first storey, second storey or roof material and trim. Please refer to the detailed description of Stage Manager to know how this is applied.
Along the top you can see columns called Category, Supplier, Description, Qty, Rate, Subtotal, Discount and Total. Each row represents a single material item ranging from the roof cover material to gutter brackets.
Supplier This is the name of the supplier of the item
Description This is the description which combines the description of the item and finish
Qty This is the quantity of each item derived from the estimate process. The unit for the quantity is described in the above table.
Rate This is the rate per item
Subtotal This is the sum of the quantity and rate
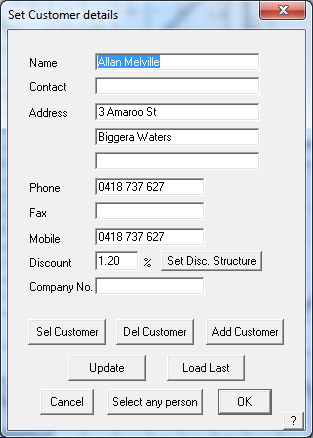
Discount This is the discount percentage you want to apply for that line item. The default value is the discount associated with the selected customer. If the value is set to a negative number, a mark-up is applied. The Discount may be pre-set for each customer – set this in the Job Info > Customer section – as shown here.
Total This is the total for this line item after applying the discount.
Below the Total column is the Job total field which is the total for the job, not just for the page you are looking at, if there are multiple pages.
The buttons at the foot of the page are:
Category – this value is simply a shorthand description of the type of item described in the following table.
| Category Name | Type of material | Unit |
| Straight | Straight metal roof material | M²/ft² |
| Curved | Curved metal roof material | M²/ft² |
| Ridge | A ridge flashing | M/ft |
| Valley | A valley flashing | M/ft |
| Fascia | A fascia flashing | M/ft |
| Gutter | A gutter | M/ft |
| Apron | An apron flashing | Mft |
| Barge | A barge (rake) flashing | M/ft |
| Step | A step flashing | M/ft |
| Batten | A batten material | M/ft |
| Flat Sheet | Flat sheet metal for custom flashings | Each |
| Fabrication | The total fabrication cost of the custom flashing | Each |
| Fasten | A fastener type | Boxes |
| Clip | A type of clip for standing seam panels | Boxes |
| Accessory | A flashing accessory item. | Each |
| Membrane | A membrane material | Roll |
| Roof tiles | Roof tiles | Each |
| Ridge tiles | Ridge tiles | Each |
| Hip starters | Hip starter piece | Each |
| Apex tiles | Apex piece | Each |
| Roof shingles | Roof shingles | Each |
| Ridge shingles | Ridge shingles | Each |
| Apex shingles | Apex shingles | Each |
| Roof shakes | Roof shakes | Each |
| Ridge shakes | Ridge shakes | Each |
| Apex shakes | Apex shakes | Each |
| Starter course | Starter course material for shingle and shake roofs | Each |
| D Pipe | A downpipe | Each |
| D Access | A downpipe accessory which could be a pop, offset, shoe or elbow. | Each |
| Extra | An extra item read in from extras.dat | Each |
| Insulation | An insulation material by the roll | Large or small |
| Ccharge | The curving charge | One off |
| Cflash | A curved flashing | Each |
| User Length | A user length value (eg vermin proofing, bird stop etc.) | M/ft |
| User | A user defined item | Each |
| Misc | A user defined item from Misc-Item | Each |
| Cartage | The number of items to deliver | Each |
![]() Note: There’s currently no way to order the items within each group (Roof/Wall Cover, Flashings/Fittings, Accessories, Fasteners) in the Supply list dialog. However, you can decide what appears in each category group, as well as the individual names of the groups. It requires you to define a category sort file.
Note: There’s currently no way to order the items within each group (Roof/Wall Cover, Flashings/Fittings, Accessories, Fasteners) in the Supply list dialog. However, you can decide what appears in each category group, as well as the individual names of the groups. It requires you to define a category sort file.
A file external to the software “Categories.CSV” saved in the \User folder, can be defined which allows for modification of these items. See the example here opened in MS Excel:
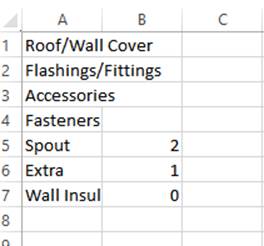
The first 4 lines define the names of the Category Groups in the Supply & Install dialog.
The remaining lines after these first 4 define category names and which category group they should be placed within. The software has default options built into it, but in the example here you can see that by placing anything with a Category name of “Spout” into Group 2 (Accessories), anything with a category name of “Extra” into Group 1 (Flashings/Fittings) and anything with a category name of “Wall Insulation” into Group 0 (Roof/Wall Cover).
Quote-Groups
This button takes you to the Quote Groups section showing you the prices for each quote group setup previously.
Each group contains the line items that will be ‘aggregated’ to create a single total cost for that group of items so that a sub-total cost for this group can be displayed on the quotation. Thus not displaying each line item cost in the quotation.
The example below has five Quote Groups – Fascia and Gutter group is displayed.
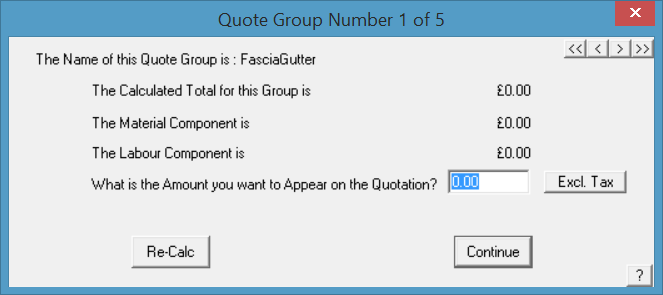
Once a Quote Group is defined, you can then create a report template that incorporates the Quote Group Details using key text strings for that group individually or as a table.
| Key text string | Description |
| ###QG”QGName”-MatSubTotal | Sub-total of Materials for specified Quote Group name |
| ###QG”QGName”-LabSubTotal | Sub-total of Labour for specified Quote Group name |
| ###QG”QGName”-Total | Total of Materials and Labour for specified Quote Group name |
For example for the FasciaGutter quote group described above you would use –
###QGFasciaGutter-MatSubTotal
###QGFasciaGutter-LabSubTotal
###QGFasciaGutter-Total
Refer to Key Text description for more details.
Changing Displayed Values
Double click the line item description allows you to change the item description for any of the items listed. The change you make is relevant to this quotation only and does not effect the definitions previously set under Materials. Change as required.
Any line item displayed in the Supply and Install list can be modified by double clicking the line item. The description can be changed and a calculation can be typed into the field.
Export Acct.
This button allows the details of the costing screen to be exported to a file that may be read into your accounting system. This presumes that your accounting program can read such files. The path for writing the file would be such that the accounting program picks it up and reads it automatically. The format is a simple comma separated values file (CSV) with each item listed as displayed in the costing dialog..

Similar to this:

Export GRIM
The Export GRIM button saves atext file in the format of AppliCad’s proprietary GRIM format. This provides a method of exporting every single bit of information anout the job from material and labour costing to panel and trim cutting lists. The GRIM file is described in detail here.
Delete Use this button to delete a previously saved quote.
Notes
When you click Notes, you next click the form report name you wish to attach a note to. For each of the standard CAD template forms, if it has a ###QQnote key-text-string, then the relevant note will appear on that CAD template form.
When the note is formatted on the report, line breaks you typed in are ignored since the notes will span the “text width” value of the ###QQnote text entity. If you want to force a line break, you must use the ^ (carot) character in the note text. The standard notes are usually defined under Tools > Define Notes. However, you can also add/edit your standard notes from the Notes function within the Supply Only or Supply and Install dialog box – the same steps apply.
Save
You can save this quote by clicking Save, then entering a name for this quote. Then you can redo another quote if you wish. The job details are saved in the Quotation Register and listed by date and time. Refer to Quotation Register explanation in the next section.
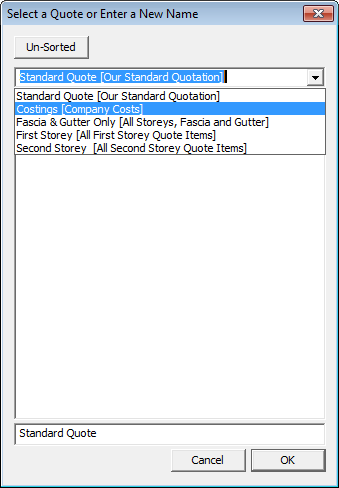
![]() Note: If you define a text file called QuotePresets.dat you can pre-set a series of pre-defined quote names to ensure that the standard quote name is used or simply to speed up the process. Once defined, the available names are displayed when you select Save from the Nett Only, Supply Only or Supply and Install dialog box.
Note: If you define a text file called QuotePresets.dat you can pre-set a series of pre-defined quote names to ensure that the standard quote name is used or simply to speed up the process. Once defined, the available names are displayed when you select Save from the Nett Only, Supply Only or Supply and Install dialog box.
Load You can load a quote you have previously saved for this job.
Print Here you can print to any predefined reports. You can select the reports you want to print on the select [Reports to Print] dialog box similar to that shown below. The reports listed may include any extra report templates that you may have created.
Refer to the section later in this manual for how we create report templates and add them to this list.

After you click [OK], each report is prepared and then sent to your printer. Like the other reports, the order forms are first pre-processed, generating one or more individual orders for each supplier. The order number on the job details dialog box is used to uniquely identify each order form.
Note the [Add/Edit] report button as per the Tools > More > Edit User Templates dialog so that reports can be created and edited as an inline process to reporting.

Add Item
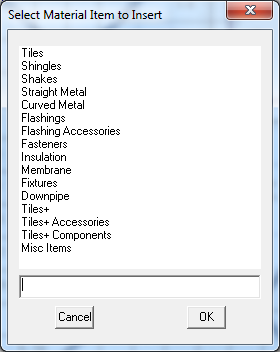
This allows the operator to add a material item from any category in the material database. Select the material category, then select the required item to be added to the material list for this job only. The added items do not relate to the roof geometry at all.
Add Other
This adds a new field to the end of the list allowing you to enter any information into the Category, Supplier and Description fields. This has replaces the User fields seen in previous versions. This is used to add such things that are required on a job that cannot be quantified as a function of the roof geometry, such as site clean up, crane hire etc.
Tile-Waste
This button displays the tile waste summary dialog box. Here you can modify specific tile waste factors for the current job. This only applies to tile roofs.
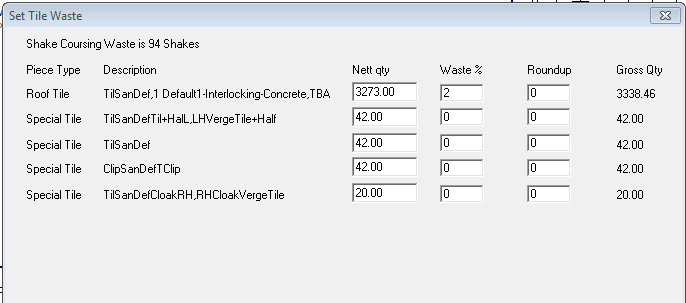
When you click “Calculate”, the Gross Qty is updated with respect to the waste percentage value and the round up value. When you click “[OK]” the Gross Qty is transferred back into the Reporting dialog box.
Cancel You can cancel any changes you have made and close this dialog box
ExportCSV This allows you to write the table of information on this dialog box to a comma separated value file, ready to import into other computer systems
ExportGRIM This allows you to write the current job as a GRIM file. If you have given this job a quote number then the name of the grim file is <Quote Number>.GRO. If you have not, the name of the grim file is GrimFileOut.GRO.
You also get separate grim files defining the materials required from each supplier. These are named Order-<Job Number>-<Index>.GRO. The format of a GRIM file is dewcribed later in this manual and how the GRIM file is used in conjunction with external systems such as a business management system.
A plot file of the roof plan is also exported in HPGL format that may be used to illustrate reports in other systems. It is saved as GrimOutFile.plt into the …\User folder.
A TIFF bitmap image file is also created. If a job number exists, then the file is called Job#.TIF. If no job number is defined, then it is called GRIMOUTFILE.TIF.
Set-Suppliers
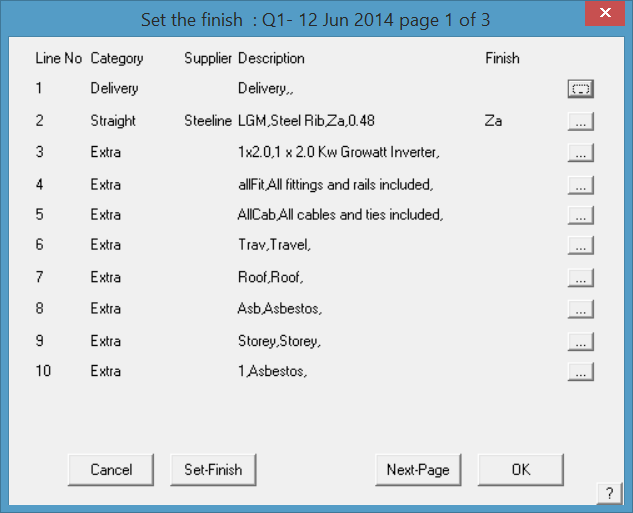
This allows you to set the supplier for each material line item. When you click this button, the following dialog is displayed.
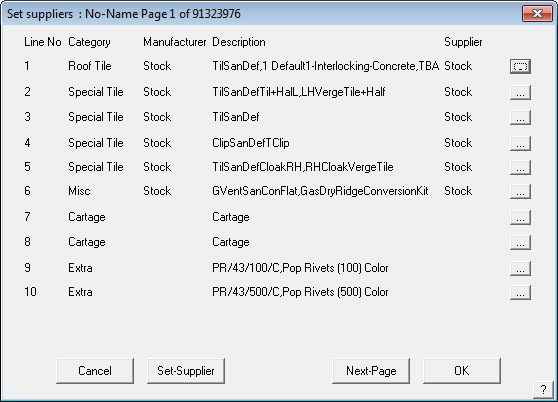
On this dialog, you see the supplier for each material line item. By default, the initial supplier name is the same as the supplier. To change the supplier you can either click the Set-Supplier button or click the ‘…’ to the right of each line item. If you click the Set-Supplier button, you can set a range of line items to affect.
Set-Finishes
This command lets you set the finish for any or all the material line items. It operates in a similar fashion to then Set-Suppliers command.
Set-Discount This button will let you set the discount for all line items.
Next-page This will display the next page, if there is one.
Prev-page This will display the previous page if there is one.
[OK] This lets you close the dialog box.
List Existing Quotes
Each time you select Supply-Only, or Supply and Install the software wants to re-calculate the quotation with the latest details and prices.
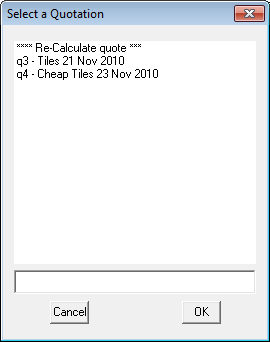
If you have already saved a quote using the Save button, when you select Supply-Only you are presented with a list of quotes in the job similar to the list box to the right.
Here you can select an existing saved quote, or select ***Re-Calculate quote *** to recalculate the quote with the latest values.
This also applies to the Supply&Install, Nett-Only and Fascia&Gutter Reporting commands.
Quote Register
The software automatically creates a register of all quotes completed, in the order they are completed. This makes it easy for the operator to go back to a previously saved quotation. In the process, the job database and model are opened and displayed on screen.
The Quotation Register is saved in a CSV (Comma Separated Values text file) format which allows the register to be used by other software such as Microsoft Excel or a business management system. The file name is QuoteRegister.CSV.
The file is in the form as shown below:
Quote Name,Database,Model,Date,Time,
...
 Q101-12May09-Tiles,BennetBldrs,34HighSt,29-May-09,14:29:03,
 Q102-12May09-Tiles,BennetBldrs,34HighSt,29 May 2009,14:29:48,
 Q103-12May09-Tiles,BennetBldrs,34HighSt,29 May 2009,14:30:47,
 Q103a-12May09-Tiles,BennetBldrs,34HighSt,29 May 2009,14:30:47,
 Q103b-12May09-Tiles,BennetBldrs,34HighSt,29 May 2009,14:30:47,
 Q104-12May09-Tiles,BennetBldrs,34HighSt,29 May 2009,14:31:50,
 ... Etc
The Quote Name is extracted from the name given to the quotation when it is saved from the Nett Only, Supply-Only or Supply+Install screen dilaogs. The list is continuously created until the data is deleted.
Some situations may require more data to be saved with the quotation list. For example, in addition to the Quote name, Database name, Model name, date and time, you might need the job cost total. To achieve this you must create a template (similar to creating a GRIM file template – refer description in Section 6 of this manual) that adds the extra information.
The template uses key text strings, as used when setting up your report templates, in the order that the data is to appear in the list. One small difference to how it is used in templates is the need to include .DAB to the end of the ###DatabaseFileName string. You create the text file using a text editor such as Notepad and the file must be called QuoteRegister.GRT (GRT as in GRIM Template). Let’s add the job total price to our Quotation Register and the first line of the file would look like this:
###QuoteName,###DatabaseFileName.DAB,###DatabaseModelName,###Today,###Time,Job Total is: $###JobTotal
This has the effect of adding the text, Job Total is: $. Then the key text string adds the dollar amount. When the Quote Register is created, and subsequently added to, the extra information is also added.
In our example, a section of the Register would now look like this:
Quote Name,Database,Model,Date,Time,
...
 Q101-12May09-Tiles,BennetBldrs,34HighSt,29-May-09,14:29:03,Job Total is: $158.69
 Q102-12May09-Tiles,BennetBldrs,34HighSt,29 May 2009,14:29:48,Job Total is: $168.12
 Q103-12May09-Tiles,BennetBldrs,34HighSt,29 May 2009,14:30:47,Job Total is: $258.34
 Q103a-12May09-Tiles,BennetBldrs,34HighSt,29 May 2009,14:30:47,Job Total is: $245.36
 Q103b-12May09-Tiles,BennetBldrs,34HighSt,29 May 2009,14:30:47,Job Total is: $228.34
 Q104-12May09-Tiles,BennetBldrs,34HighSt,29 May 2009,14:31:50,Job Total is: $162.69
 ... Etc
The extra text, Job Total is: $ and the dollar value added. This set up of the QuoteRegister template can be set up to be as complex or as simple as required for providing the information you need to help run your business.
Headings for each column of cells that you define, in addition to the Date, Time etc, must be manually inserted in to the CSV file the Job Total is: $ for example. The heading would then read:
Quote Name,Database,Model,Date,Time,Job Total is: $
Recalling Jobs from the Quote Register
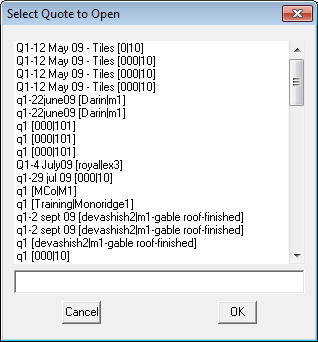
When going back to a job, the operator has the option of simply opening the Database and Model, or you may use File > Open Quote. This presents the full list in the Quote Register in chronological order. Select the quotation you wish to open and the software opens the right Database and Model and then accesses the quotation.
Modify Quote Total
This option allows the operator to modify the final total quotation price for the job and will be saved with the quotation.
Select the [=] button and a box is displayed that displays the job total price calculated by the software based on all materials (and labour) for that job. This may be adjusted up or down, and the new job selling price inserted. This new value is displayed in the Job Total (ex tax) and a new line item displayed which is the value of the adjustment to the job total, up or down.
This is described as a rebate or extra and is saved as a Key Text called ###Rebate (refer Appendix). Such variations to a customer’s quotation can then be displayed on the office or sales person’s copy of the quotation by adding the Key-Text String to the office copy template.

Left click in the field that you wish to modify, in this case the Job Total, change the amount to that required and the adjustment will be shown in the Rebate/Extra field, as shown below.

A negative number is a rebate or discount, a positive number is an extra or additional amount.
The Rebate/Extra is a random adjustment that is made by the estimator at the late stage of closing off a job and making the call to round up or down a quote. If you add an amount to say, round the quote up from $14,797.00 to $15,000.00 then that is an adjustment up (Extra) or if you round it down to $14,000.00 then that is a Rebate. The difference is the amount that gets applied to the Quote Groups if enabled when Quote Groups are set up [Add in Pro-Rata % for Extra/Rebate – Y/N]. It does this so that the Quote Group sub-totals make sense – that is, the adjustment amount is pro-rated back across the respective Quote Groups items. If you had, for instance, 5 quote groups and the rebate total for each one was $100 (unlikely, but stay with me), then providing a rebate of $500 would subtract $100 from each of the Quote-Group Totals. This is done to allow the Quote Groups total to sum to the total of the Supply & Install dialog, after the rebate/extra has been applied.
Sales tax is applied if defined in System Preferences and the Total (including tax if applicable) is displayed and this is the amount printed on the customer’s quotation.
An additional line under Material Items shows the calculation of the material cost based on a square metre (or square foot) rate determined by the material cost divided by the roof area. This is handy as a cross check of the job cost to ensure that you haven’t made any significant error in your quotation. A similar line exists for Labour when you do a Supply and Install costing.

Job-Info and Options
The [Job-Info} button on the Supply-Only dialog allows you to change details about the Job, Customer, Installer etc without having to back up out of this dialog and have it recalculate the costings.
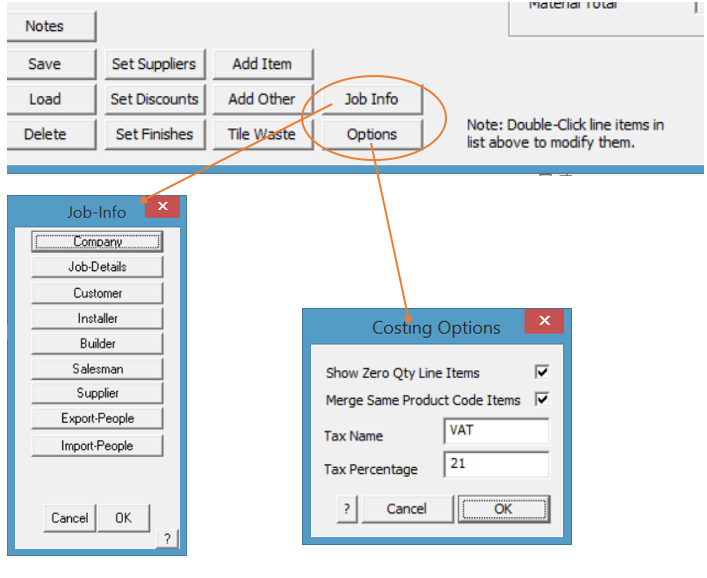
The [Options] button takes you directly to the Preference Settings that relate to the job costing dialog screen without having to back up out of this dialog and have to recalculate all the values.
![]()
Note: This is only saved with the current estimate if you select [Save]. If you quit the Supply+Install dialog without saving, these changes are lost.
Reporting > Supply+Install
When you click Reporting > Supply+Install, all the materials are tallied, sorted and displayed on the Materials dialog box as well as the installation charge displayed on the Labour sub-total dialog.

The reporting for the job takes account of stages defined using Stage Manager such as first storey, second storey or roof material and trim. Please refer to the detailed description of Stage Manager to know how this is applied.
The title on the dialog box describes the name of the current quote as well as what page is displayed.
This dialog is similar to that for Supply-Only, except you can alter the labour charges as well as assign markup percentages to the labour and material charges. Only the differences between the two costing systems are discussed here, so please read the previous section, Supply Only.
Any line item displayed in the Supply and Install list can be modified by double clicking the line item. The description can be changed and a calculation can be typed into the field.
Labour Subtotal
Clicking the Labour Sub-total displays the Roofing labour charges dialog box for this job.
For each item, there is a quantity, a rate and the total. The labour total is then the sum of the individual totals. Most of the items and rates are derived directly from the Reporting labour-rates dialog box plus those items defined in Extras.csv.
For details of Extra items, refer to Set-Up > More… > Extras.

The value labelled User lengths, is derived from the Cover > Flashing > User-Lens command.
![]()
Note: If you need a pay rate that takes account of pitch use Tiler’s Pay where you can define multiple pitch intervals.
The quantities on this dialog box are either NETT or GROSS depending on what you set on the Set Up > Metal-Rates dialog box.
In the Roofing labour charges dialog box you can alter the quantities and rates. Those changes you make will only effect the current job.
Labour markup This is the labour mark-up percentage.
Labour total This is the labour total amount including the labour mark-up percentage.
Material subtotal This is the sum of the material costs.
Material markup This is the material mark-up percentage.
Material total This is the material total amount including the material mark-up percentage.
Job total This is the total cost for the job including material and labour.
Modify Quote Total This option allows the operator to modify the final total quotation price for the job and will be saved with the quotation.
In addition, we have also provided totals for each line item to the right, and a cost per unit area option for both Materials and Labour, to assist our customers to understand their estimating pricing against the roof and wall areas.

The job total price calculated by the software based on all materials (and labour) for that job. This may be adjusted up or down, simply double click inside the price cell, and the new job selling price inserted. This new value is displayed in the Job Total (ex tax) and a Rebate/Extra value is displayed which is the value of the adjustment to the job total, up or down.
This is described as a rebate or extra and is saved as a Key Text called ###Rebate. Such variations to a customer’s quotation can then be displayed on the office or sales person’s copy of the quotation by adding the Key-Text String to the office copy template.

Left click in the field that you wish to modify, in this case the Job Total, change the amount to that required and the adjustment will be shown in the Rebate/Extra field, as shown below.

A negative number is a rebate or discount, a positive number is an extra or additional amount. Sales tax is applied if defined in System Preferences and the Total (including tax if applicable) is displayed and this is the amount printed on the customer’s quotation.
 Fascia-Gutter
When you click Fascia-Gutter, the following dialog box is displayed.

This reporting method simply displays the materials for fascia and gutter and provides a quick quotation method for fascia and gutter only jobs. All too often valley material is also required, so it is included. The process for generating a quote and producing reports is the same as the other reporting methods. By design, the rate for the gutter material in this example is set to zero.
 Nett-Only
When you click Nett-Only, the following dialog box is displayed.

This Reporting process gives you access to a Reporting method based on price per unit area of roof and per unit length of line category. (You set the base prices using Set-Up > Set Up Pay Rates > Nett-rates). The pricing method simply reports a fixed set of line items (roof and trim) and uses the geometric (nett) values as the quantity. So if you quote by price then simply model the roof and go to the Reporting option. You do not need to select the specific roof cover material or define flashings, battens etc as your pricing would typically include any variations.
As you can see, you have the same facilities as on the Reporting Supply-Install dialog box.

If you wish, you can select a line item, and insert your own description for each and every line item. These changes relate to this quotation only. Don’t forget to select the Save button when you’re finished preparing the quotation so that the same details can be recovered later.
Bill of Quantities
A useful feature of the Nett-Only quote is that you can also do a quote on the nett areas of the roof without having to draw it up. If you have been given all the quantities of the roof you can simply enter them into the Quantity field, and click Re-Calc, the material side of the job will then be costed for you. This is particularly useful when you have been given a Bill of Quantities from the local Quantity Surveyor with no roof measurement details. This is process seems prevalent in the UK market where many jobs are supplied as a Bill of Quantities only, for whole or part of the roof job.

Select the [Options] button and you will be asked if you wish to display zero quantity items. In this case you would of course, so that you can add the numbers that you need for the job.

Double click a cell in any line item and change the value in it.

If you need to do labour as well as materials, simply click on the Copy Quantities to Labour Items >> button and all the quantities that you have entered into the material fields will automatically be copied into the corresponding labour fields. You will still need to click on the Labour Subtotal button to ensure that the labour is calculated.
These functions may be used in conjunction with QuoteGroups to produce custom quotations often required when responding to requests for quotations from a Quantity Surveyor who supplies you with the quantities to be used and you supply the costings for your company to deliver the goods and services.
 Drawings
When you click Drawings, you can now print up to 8 different standard CAD drawings or any number of drawings saved as Microsoft Word or Excel Templates. Refer to the process description for creating these at the end of this section of the manual.
The Select Drawings to print dialog box is displayed from which you select the drawings you want.
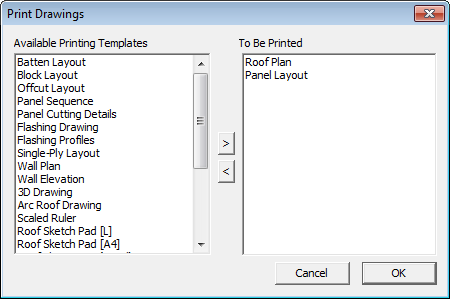
| Drawing Name | Template Name | Intended Use |
| Roof drawing | Drawing-Roof | Shows the roof |
| Batten drawing | Drawing-Batten | Shows the battens on the roof |
| Block layout | Drawing-block | Shows the blocks on the roof as created by Auto-Block |
| Off-cut layout | Drawing-off-cut | Shows the cuts and off-cuts created by Gen-Off-cuts |
| Off-cut layout(Colour) | Drawing-Off-cut-Colour | Shows a colour coded printout of the Off-cut Layout |
| Panel layout | Drawing-sheet | Shows the sheets on the roof as created by Gen-Sheets |
| Panel sequence | Drawing-Sheet-Sequence | Shows the sequencing of panel cutting derived from Linear Nesting |
| Panel cutting details | Drawing-Sheet-Cutting | Shows the detailed dimensioned panels |
| Flashing drawing | Drawing-flashing | Shows the roof and dimensions for each roof line as detailed by Dimension-Roof Lengths |
| Flashing profiles | Drawing-Flashing-profiles | Details the workshop drawings for the fabrication of custom flashings. The standard template has four profiles displayed with the following fabrication details for each new profile, and the cutting list of required lengths for the job. A new page is automatically created for each new group of up to four profiles. |
| Single-Ply Layout | A4-Form | Shows the membrane layout generated by Cover > Select-Membrane > Layout-SinglePly |
| Wall Plan | Drawing-Wall-Plan | Shows a plan view of your wall outline |
| Wall Elevations | Drawing-Wall-Elevation | Shows you the elevations of each wall outline |
| Arc Roof Production Drgs | Found under Cranking.DAB | Details the workshop drawings for the fabrication of curved roofing |
| 3D Design Drawing | Drawing-3D | Shows the roof in a 3D view |
| Scaled Ruler | No template | Creates a scaled ruler with any odd-ball scale which allows random measurements to be taken from a copy of a plan. |
Once you click [OK], the particular drawings you want to print are first prepared for printing and then sent to your printer.
Section Reports
Several additional report options are available that allow for the ability to create individual metal cutting list reports per roof plane.
The standard Sheet Cutting List Summary is created looking at the entire roof and putting short panels together to meet the Min Length setting when turned on in your panel allowances.
However, the Section Report is an entirely separate process and looks at each roof plane individually, and puts short panels together to meet the Min Length setting one roof plane at a time. So one cutting list may not be the same as the other, because the short panels are not nested in the same way or at the same time.
You cannot mix and match them – they are two distinctly separate outputs and most times, will not parallel each other and may indeed cause confusion for you and your customers.
The positive aspect of this is that, in general, the total length of coil for the job stays the same, regardless of the method used to generate the cutting list output – except when a single 10” piece becomes a single 4’1’ piece for example (if your min length is set to 4’1″) which does add a few extra inches or millimetres to the panel lengths for Section Report because it is not agregated over the whole roof, but one roof plane at a time.
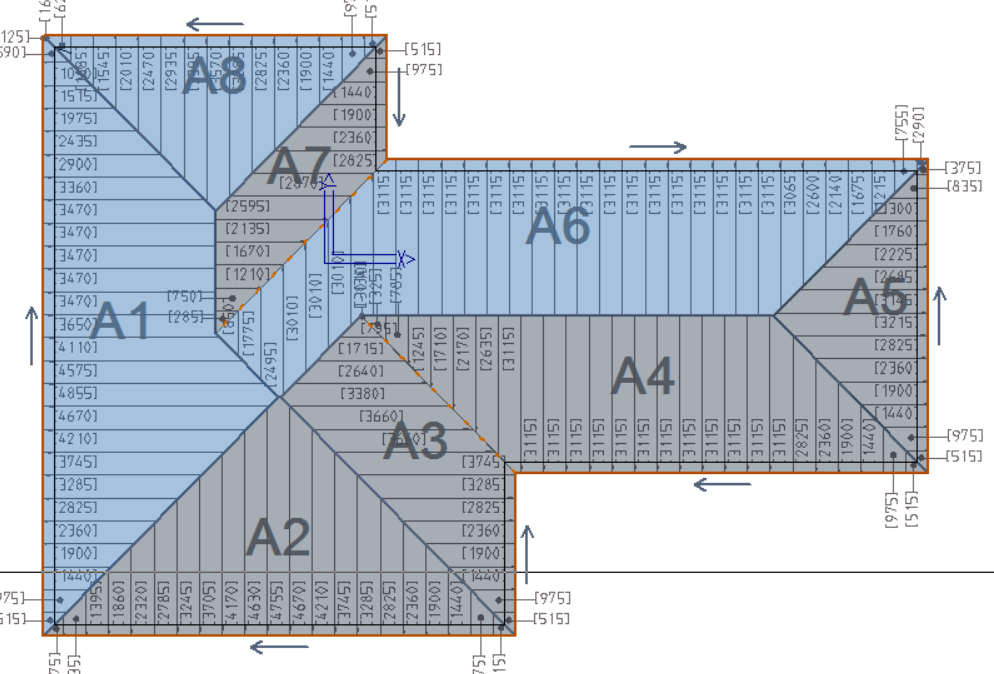
To prepare for a “Section Report” as we have named them, the user must define various areas of the roof as sections (typically “A”, “B” etc.) and then number individual roof planes within each section using the Set-Section function under Estimate > Set-Panels.
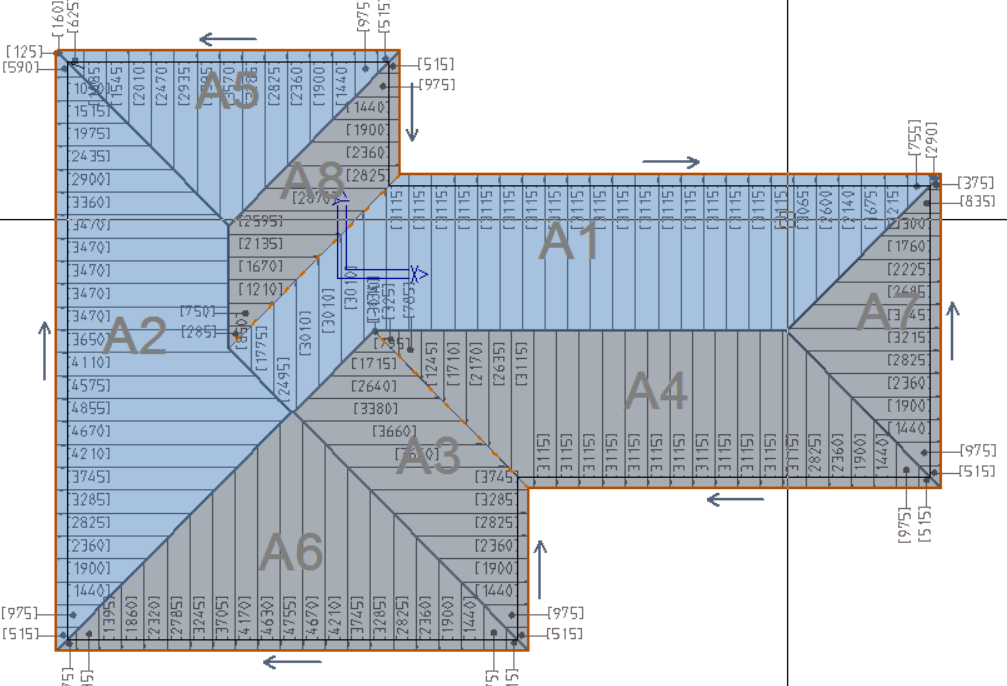
You use the Set-Sequence button to change the order of the plane areas to suit your method of working – typically from longest roof panels to shortest.
Once this is complete, a Section Report can be produced by simply utilising the ###SectionReport, ###SectionReport2 or ###SectionReport3 key text strings in your report template which will result in a report similar to that shown below with the plane area and the cutting list for that plane.
###SectionReport
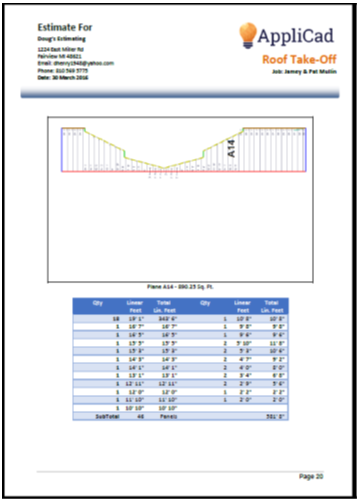
###SectionReport provides a layout of each roof plane in turn, and includes waste and plane area in the corresponding cutting list table for each plane area of the model.
###SectionReport2
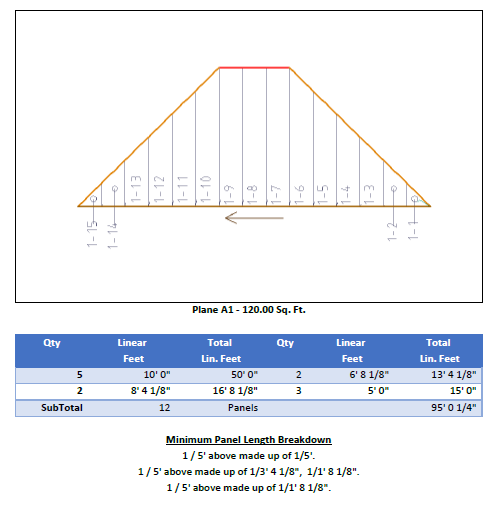
###SectionReport2 provides a cutting list table for each plane area of the model and includes waste and plane area, without the graphical depiction of the roof plane area.
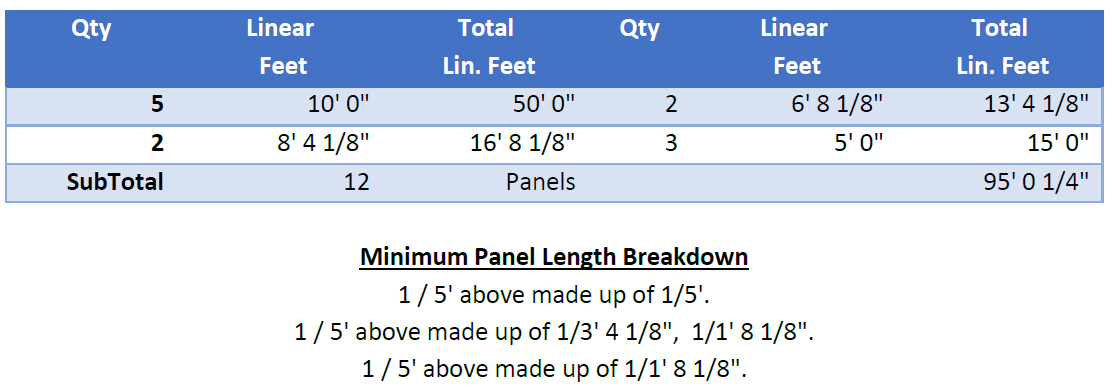
###SectionReport3
Removes the plane annotation numbers from plane imagery, as well as using double columns, losing Waste and Total Area per panel in the process over ###SectionReport.
Below is a closer look at the two column format of the SectionReport3.
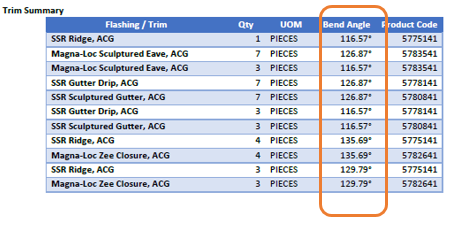
Typically associated with the full blown commercial mode reports are the Flashing Table which includes the angle of bend for each piece of trim. The angle of bend is calculated automatically by the software from the roof geometry. It uses the pitch of the roof and the angle made between adjacent roof planes.
New “section-style” tables have been created for users who want an abridged version of the current report table capability, but with a focus on ensuring all information is contained for manufacturing purposes. The two new key text strings are ###SectionStyleTable and ###WallSectionStyleTable and output panel cutting lists for metal panels on both roof and wall estimations.

###FlashingTable
Available for commercial roofing to display bend angle of flashing, the number of pieces of each length and the product code:
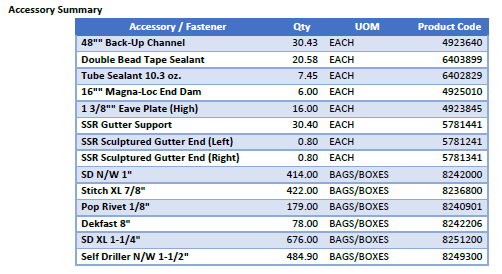
###FlashAccesstable
Available for commercial roofing to display accessories and fasteners associated with all the trim and panels in that job:
###ExtrasTable
Displays any Extra items selected for the current estimate.

Wall and Roof Facet Reports
Additional capability is available to display roof and wall models in isometric view and provide summaries of areas, pitches, lengths etc.


###ROOFFACETTABLE
Produces a table of roof facets, labelled with A, B, C etc. and a companion table of facet letter, area and pitch.
###ROOFFACETTABLE2
Produces a table of roof facets, labelled with A, B, C etc. and a companion table of facet letter, area and pitch and plane type (material).
###ROOFFACETTABLE3
Produces a table of roof facets, labelled with A, B, C etc. and a companion table of facet letter, area and pitch and plane type (material) and azimuth.
###WALLFACETTABLE
Produces a table of wall facets only, labelled with A, B, C etc. and a companion table of facet letter, area and plane type. (see example below)
###WALLFACETTABLE2
Produces a table of wall facets with windows and doors, labelled with A, B, C etc. and a companion table of facet letter, area and plane type.
###WALLFACETTABLE3
Produces a table of windows and doors only, labelled with A, B, C etc. and a companion table of facet letter, area and plane type.
To get the most from this simply requires trial and error and clever layout and design of your templates.
Pay Rates
Set up > Pay Rates takes you to the Labour setup commands – specifically,
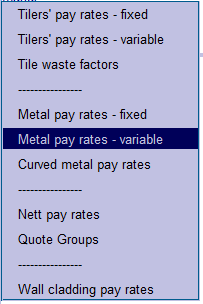
Tilers’ pay rates – fixed Allows you to setup fixed tile rates.
Tilers’ pay rates – variable Allows you to setup variable tile rates – with increments for storey and pitch interval.
Tile waste factors Allows you to setup tile waste factors.
Metal pay rates – fixed Allows you to setup fixed metal rates.
Metal pay rates – variable Allows you to setup variable metal rates – with increments for storey and pitch interval.
Curved metal pay rates Allows you to setup curved metal installation rates.
Nett pay rates Allows you to setup nett pay rates ie nett cost/m².
Quote Groups Allows you to setup Quote Groups.
Wall cladding pay rates Allows you to setup Wall cladding installation rates.
The functions for pay rates may also be selected from the Reporting Icon menu for ease of use. This allows you to quickly jump back and change a lbour rate while still in the Reporting stage.
Tilers’ Pay Rates
Tilers’ Pay Rates – Fixed
This command displays the Roof Costing-Rates dialog box allowing you to set or change various quote rates and job cost rates associated with the estimate on a per square basis or per unit length. There is one rate regardless of pitch of the roof or storey number. The items are described below:
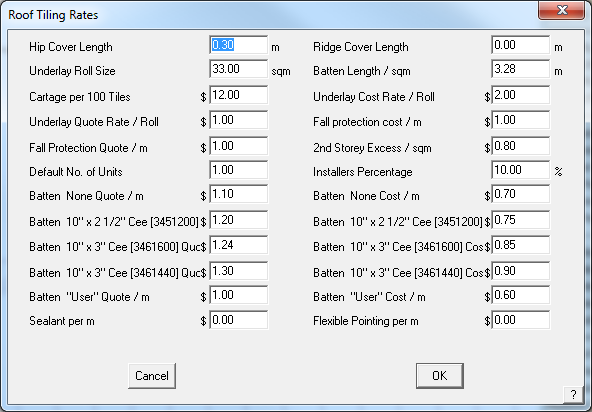
Hip cover length This value determines the number of hip tiles required. It is independent of the tile you selected.
Note that it is not used if you have supplied a hip tile length when you defined the tile using Set-Up > Tile.
Underlay/Sarking roll size This value determines the number of rolls of underlay.
Cartage per 100 tiles This value determines the total delivery cost.
Underlay/Sarking quote rate This is the rate to quote underlay/sarking.
Fall protection quote This is the rate to quote fall protection.
Default no of units This is the default number of housing units for this job.
Batten 50×25 quote This is the rate to quote 50×25 battens.
Batten 50×38 quote This is the rate to quote 50×38 battens.
Batten 50×50 quote This is the rate to quote 50×50 battens.
Batten 75×50 quote This is the rate to quote 75×50 battens.
Batten User quote This is the rate to quote the user defined batten.
Ridge cover length This value determines the number of ridge tiles required. It is independent of the tile you selected.
Note that it is not used if you have supplied a ridge tile length when you defined the tile using Material > Tiles.
Batten length This is the length of battens per m2 of roof. It is used if you perform the estimate using the area method.
Underlay/Sarking cost rate This is the cost of the underlay/sarking.
Fall protection cost This is the cost of the fall protection.
2nd storey excess An extra value for second storey work.
Installers percentage The extra percentage to apply to the installers pay.
Batten 50×25 quote This is the cost of 50×25 battens.
Batten 50×38 quote This is the cost of 50×38 battens.
Batten 50×50 quote This is the cost of 50×50 battens.
Batten 75×50 quote This is the cost of 75×50 battens.
Batten User quote This is the cost of the user defined batten.
Waste per course The number of tiles you want to add per course if using the coursing method.
Waste – area method The number of extra pieces you want based on the total length of hips and valleys.
Sealant The rate per metre to add sealant to the trim. You define the finish of the ridges, gables and valleys etc as “Seal” to get a sealant value added to the Reporting dialog box.
Flexible pointing The rate per metre for flexible pointing.
![]()
Note: The cartage per 100 tiles variable described above will not appear in the Supply and Install dialog if the value is set to 0. If a value is included, then it will appear and the value determined by the number of tiles ordered. If a value is set, then it will appear in the material list summary, even if you have not estimated for tile. This will be added to the material list even if a value is also set for delivery under Areas – refer to Set-Up > Areas.
 Tilers’ Pay Rates – Variable
This command lets you define tile installer pay schedules based on storey, line-item and user defined pitch interval. This Pay Rate may be applied to either Tiles or Tiles+ databases. You may define as many Tile-Pay rates as you need – for example, union or non-union rates; or sub-contractor A and sub-contractor B rates. Just remember, the more rates you set up the more you have to maintain if rates change, as they inevitably do.
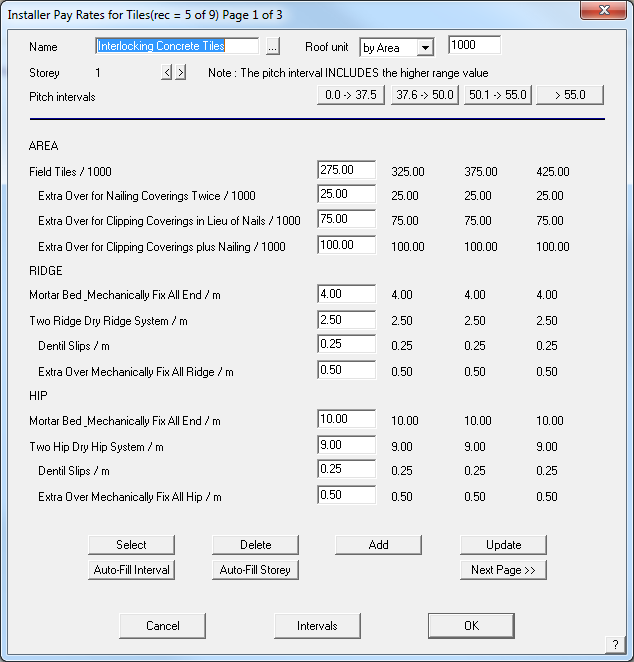
Name This is the name by which you select this pay rate in future.
Roof Unit The basis on which the costs are applied and the multiplier.
Storey This is the storey to which these values relate. You can have up to 10 storeys for the one pay rate.
Pitch intervals These values reflect those you set with the Intervals button at the foot of the dialog box. For each pitch interval value, you get a column of numbers associated with a line item. To edit a line item, highlight that column by clicking the pitch interval label.
Roof / sqm (sqFt) This is the installers rate to lay tiles on the roof.
…. The rest of the line items relate to hip, valley, gable and barge finishes you select under Cover > Select-tile.
Select This allows you to select an existing pay rate schedule.
Delete This allows you to delete an existing pay rate schedule.
Add This allows you to add a new pay rate schedule.
Update This allows you to update an existing pay rate schedule.
Auto-Fill Interval Automatically fills the table with the loading for each pitch interval.
Auto-Fill Storey Automatically fills the table with the loading for each storey.
Once the pricing table has the appropriate rates for each job function completely filled in, and don’t forget to do each storey, the file is saved away in the system using the “Add” button. Standard pricing files are stored within the software structure however user-defined pricing files are stored in a <filename>.DPT file format. In our example we created a labour pay rate file called “Interlocking Concrete Tiles” so this will be saved as InterlockingConcreteTiles.DPT.
Once the pricing table has the appropriate rates for each job function completely filled in, and don’t forget to do each storey, the file is saved away in the system using the “Add” button. Standard pricing files are stored within the software structure however user-defined pricing files are stored in a <filename>.DPT file format. In our example we created a labour pay rate file called “Interlocking Concrete Tiles” so this will be saved as InterlockingConcreteTiles.DPT.
The <filename>.DPT file is saved in a text file which allows you to make changes in an external program such as Notepad or Wordpad, or indeed, a spreadsheet program such as Excel. This is useful if you have major changes to pricing across the board and changing the values in columns is a whole lot easier in Excel if you know how. For the rest of us, open the pricing file in AppliCad (Costing > Tile-Pay) and do it long hand, one item at a time. Once complete don’t forget to select “Update” and the changes will be saved.
Interval Labels
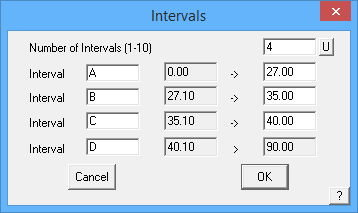
Customers utilising the GRIM output feature of AppliCad to link the estimation process to downstream systems have often had to create duplicate mappings of labour rates due to the output of variable labour rates in the Roof Wizard software. Outputs such as Ridge (1, 22.5) where the 1 specifies the storey and 22.5 specifies the pitch have had to create multiple mappings for each pitch gradient in 0.1 degree increments. In 8.2, we have provided the ability for each pitch interval to be given as a label (e.g. A, B, C as can be seen in the attached image) with the output therefore being Ridge (1,A), or Ridge (1,B) etc. This greatly reduced the number of mappings required, thus reducing the workload for our users and speeding up the interface between systems.
Labour Item Decriptions
Also available is the ability to define the Labour item descriptions. These definitions are stored in a text file called LabourFile.dat and may be created or edited in a text editor such as Notepad or Wordpad.
The quick way to create the user defined group description file is to copy the file “LabourFile.TMP” to “LabourFile.DAT” in Windows Explorer, and then make any modifications using a Windows-based text editor such as NotePad or WordPad. Only attempt to edit this file if you are proficient in the use of the editor program. To return to standard groupings, the user must remove the file “LabourFile.DAT” so that the “LabourFile.TMP” in the user directory is found instead. You might also open LabourFile.TMP in the editor and use File | Save-As to create the LabourFile.DAT with your new descriptions and charges.
This will handle every permutation of Reporting for your tile item installation options.
The format of the LabourFile.dat:
 #Tile Labour File
#Line above must remain in file for it to be located by software
#Format 0=Header, 1=Main Cost, 2=Add Cost > Group Description > Reporting Calculation Method 1=Area, 2=Len |Group - see below
#1 = Field Tiles, 2 = Ridge, 3 = Hip, 4 = Valley, 5 = Verge, 6 = Eaves, 7 = Abutments, 8 = Aprons, 9 = Box Gutters, 10 = Battens,
11 = Counter Battens, 12 = Insulation, 13 = Sarking/Underlay, 14 = Fall Protection, 15 = Downpipes, 20 = Extras
#Last option defines whether default is to include in Pricing or not 0=No, 1=Yes
0|AREA|0|1|0
1|Field Tiles|1|1|1
2|Extra Over for Nailing Coverings Twice|1|1|0
2|Extra Over for Clipping Coverings in Lieu of Nails|1|1|0
2|Extra Over for Clipping Coverings plus Nailing|1|1|0
0|RIDGE|0|2|0
1|Mortar Bed & Mechanically Fix All End|2|2|1
1|Two Ridge Dry Ridge System|2|2|0
2|Dentil Slips|2|2|0
2|Extra Over Mechanically Fix All Ridge|2|2|0
0|HIP|0|3|0
1|Mortar Bed & Mechanically Fix All End|2|3|1
1|Two Hip Dry Hip System|2|3|0
2|Dentil Slips|2|3|0
2|Extra Over Mechanically Fix All Hip|2|3|0
2|Arris/Bonnett Hip|2|3|0
2|Mitred Hip|2|3|0……………….etc
Below is a screen shot of the file we created for the demonstrating the function. Notice the header of the file shows the order in which the information must be input. Once setup, you have total control over the descriptions you use for each labour item. This includes whether the labour relates to Field tile, ridge or hip etc, the description and the cost per area or per length.
The “LabourFile.DAT” file has the following format, as outlined in the header of the file:
# = Comment Line
A|B|C|D|E = Data Line, where:
A 0 = Header Line
1 = Main Cost
2 = Additional Cost
B Line Item Description
C 1 = Item to be priced by Area
2 = Item to be priced by Length
D 1 = Field Tile Catgeory
2 = Ridge Tile Category
3 = and so on, see documentation
E 0 = Do Not include in pricing calcs by default
1 = Include in pricing calcs by default.
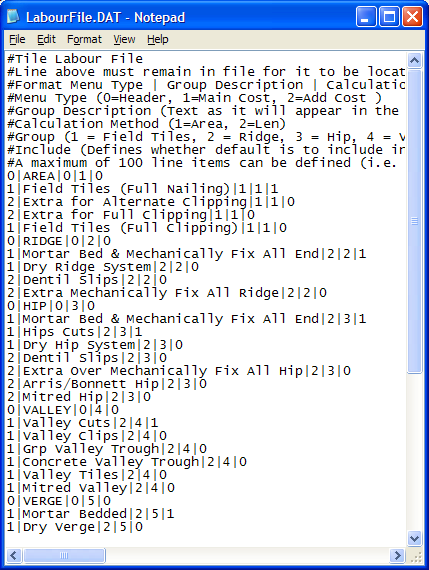
Screen captured from the LabourFile.dat being edited in Windows Notepad
The pay rate is selected when the tile is selected to cover the roof under the Cover > Tiles command.
For the Tiles+ database select it here:
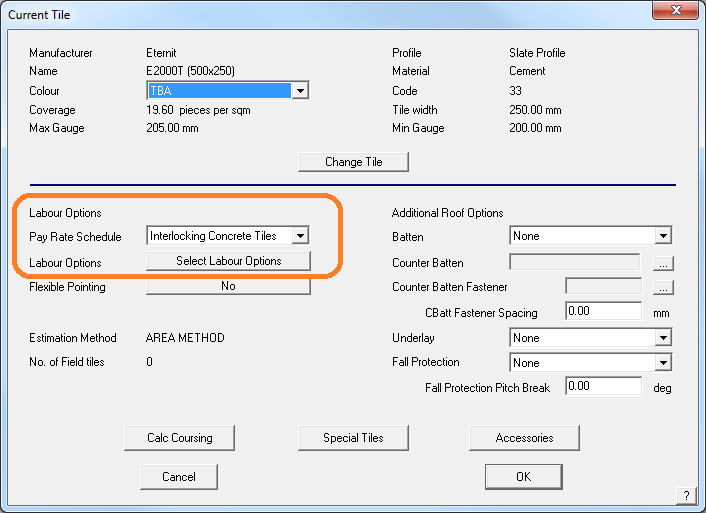
The selected tile details dialog for Tiles+ data file.
Click the down arrow for a drop down list of available pay scales that you have defined.
![]() Note: Should the pay rate be changed for any reason after you have selected it, then you must reselect the rate. Indeed, this applies to any database of materials or Reporting – if it is changed, you must re-select it and re-calculate the costing.
Note: Should the pay rate be changed for any reason after you have selected it, then you must reselect the rate. Indeed, this applies to any database of materials or Reporting – if it is changed, you must re-select it and re-calculate the costing.
Remember: After creating a new labour file, test it on a simple job to ensure the descriptions are transposed correctly. If it works correctly, then you are ready to use it on real jobs. This is a good tip whenever you change or update a data file, whether a labour or material data file.
For the Tiles database, select the pay rate here:
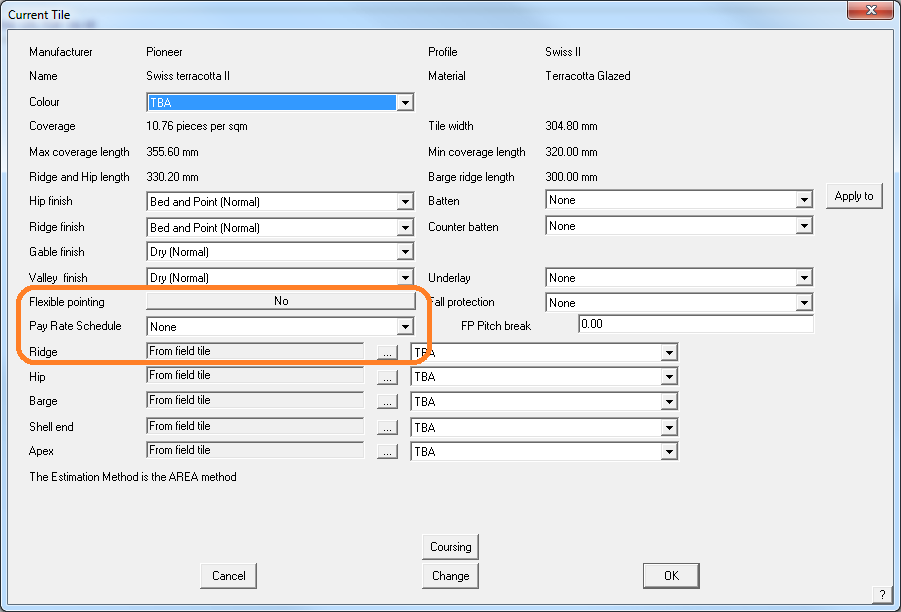
The selected tile details dialog for Tiles data file.
![]() Note: Should the pay rate be changed for any reason after you have selected it, then you must reselect the rate. Indeed, this applies to any database of materials or Reporting – if it is changed, you must re-select it and re-calculate the costing.
Note: Should the pay rate be changed for any reason after you have selected it, then you must reselect the rate. Indeed, this applies to any database of materials or Reporting – if it is changed, you must re-select it and re-calculate the costing.
Tile-Waste
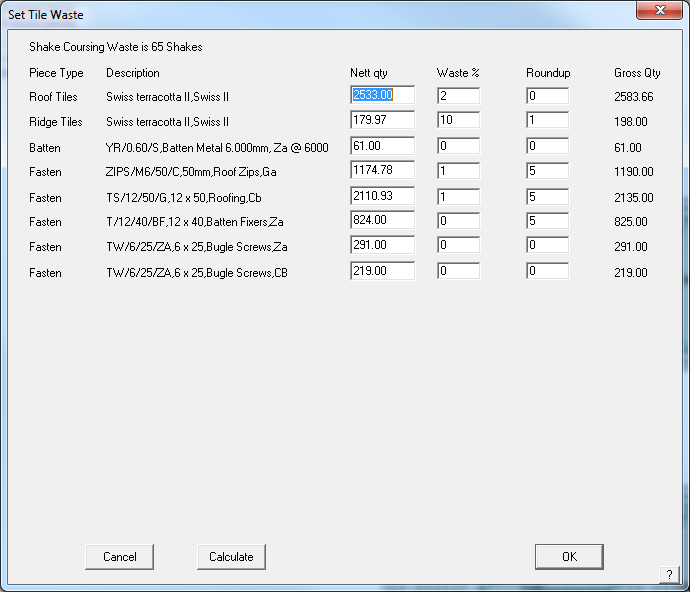
This command displays the Tile-Waste dialog box allowing you to set or change the wastage factors for different tile items.
The tile wastage values are calculated in the following sequence:
The nett number of field tiles is first calculated,
Then the number of extra pieces per course is added,
Then the extra number of field pieces per length of hips and valleys is added (field pieces per metre or per foot of hip and valley),
Then the percentage waste of field pieces is added,
Then the total number of field pieces rounded to give the final number.
Each waste value is applied in turn. If you do not want a particular waste factor to be applied then set the value to zero.
The first option – Extra Field Pieces (per course) is a number or decimal fraction, of a tile to add at the end of each course line to account for waste as a result of typical job variables such as breakages. The more course lines, the more field pieces that are added to the total tile count.
Extra Field Pieces (per length of hip and valley) is applied as a result of the total length of hip and valley combined and expressed as pieces or decimal fraction of pieces, per metre (or foot) of hip and valley. This is typically used to account for extra tiles that may be required as a result of breakages during cutting of tiles to fit at hips and valleys.
The more cuts there are, often the more breakages there are. No account is made for the re-use of the off-cut, as is sometimes possible with metal tiles.
If the off-cut is reused as a matter of course, then this needs to be taken into account and the number reduced. Experiment with different values until you get the correct result based on your experience.
All other fields are individual values for each category of tile piece. Waste % takes the total number calculated based on the course lines and adds the specified percentage and then rounds up to the nearest value as specified. A value of zero does not round up.
Multiple configurations of tile wastage and rounding of elements can be specified and saved into various configuration files. These files can now be linked to each tile record, thus allowing improved streamlining of waste and rounding calculation without requiring the estimator to remember to modfiy these values. Select [Save-As] to save the tile waste file and select [Load] to load a previously defined set of values.
When you click [OK], the values are saved. These values are applied to the tile calculations when the Reporting > Supply+Install is selected. A summary of the tile waste calculations is then displayed when you select Tile-Waste from the Supply+Install or Supply-Only dialog box.
Metal Pay Rates
Metal Pay Rates – Fixed
This command displays the Roofing Labour rates dialog which allows you to set installation rates for different categories of roofing items on a per square basis or per unit length. There is one rate regardless of pitch of the roof or storey number. The following table describes the rates:

Labour Rate |
Description |
Straight roofing per m2 |
The rate to install straight sheeting on the roof (or verandah) |
Insulation per m2 |
The rate to lay the insulation |
Ridges/hips per m |
The rate to install the ridges and hips |
Valley per m |
The rate to install valley flashing |
Fascia only per m |
The rate to install fascia flashing only |
Gutter only per m |
The rate to install gutter only |
Fascia barge per m |
The rate to install fascia on a barge |
Fascia and gutter per m |
The rate to install fascia and gutter together |
Barge per m |
The rate to install barge flashing |
Apron per m |
The rate to install apron flashing |
Batten per m |
The rate to install battens |
Each Downpipe |
The amount to install each downpipe |
Each chimney |
The rate to cater for each chimney |
Labor markup % |
The percentage the total labour cost will be marked up in the final costing |
Labour quantities |
This is either “NETT values” or “GROSS values”. Nett values are the geometric values of the roof. Gross values are the quantities of materials you order. Setting the method here will effect the quantity you see in the Reporting dialog boxes later. They only apply to metal eoofing and metal flashing quantities for all methods of labour calculation – fixed and variable. |
Siding per sqm |
The rate to install siding per square metre |
Wall top per m |
The rate to install wall top flashing |
External corner per m |
The rate to install external corner flashing |
Internal corner per m |
The rate to install Internal corner flashing |
Door head per m |
The rate to install door head flashing |
Door edge per m |
The rate to install door edge flashing |
Box gutter per m |
The rate to install box gutter |
Curved roofing per m2 |
The rate to install the curved sheeting on the roof (or verandah) |
Each curved sheet |
The amount to add for each curved sheet |
Per curved apron |
The amount to add for each curved apron (bullnose verandahs) |
Per curved barge |
The amount to add for each curved barge (bullnose verandahs) |
Per curved hip |
The amount to add for each curved hip (bullnose verandahs) |
Per curved valley |
The amount to add for each curved valley (bullnose verandahs) |
Curved apron per m |
The rate to install curved apron (bullnose verandah) |
Curved barge per m |
The rate to install curved barge (bullnose verandah) |
Curved hip per m |
The rate to install curved hip (bullnose verandah) |
Curved valley per m |
The rate to install curved valley (bullnose verandah) |
Roof removal per m2 |
The rate for roof removal |
Gutter removal per m |
The rate for gutter removal |
Material markup % |
The rate to markup the material costs for the final quote |
Wall base per m |
The rate to install wall base flashing |
Window sill per m |
The rate to install window sill flashing |
Window head per m |
The rate to install window head flashing |
Window edge per m Wall Batten per m |
The rate to install window edge flashing The rate to install wall battens per metre |
After you make a change and click [OK], the changes are saved in rates.bin for use in all future jobs.
If you click the Pitch Allowance button the Pitch Allowances dialog box is displayed.
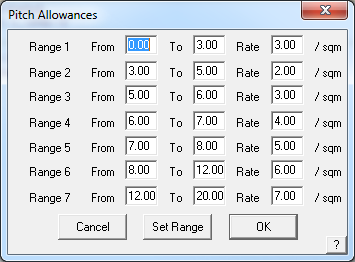
Here, you set the pitch ranges as well as the rate to apply for planes in that range. When you click Set Range, you can change the number of ranges. The maximum number of ranges you can have is 10.
These values are used in the labour charge calculation under Reporting > Supply+Install. Each plane in the model is tested for its pitch and area, and based on the roof pitch, the above table is used to derive a pitch allowance. The individual pitch allowances are added together to derive the total pitch allowance.
Metal Pay Rates – Variable
This command displays the Installer Pay Rates for Metal roofing box allowing you to set or change various labour rates associated with the installation of metal roofing. You select a pay-schedule for a job on the Cover > Select-metal dialog box. The maximum number of different labour rate tables is 50.
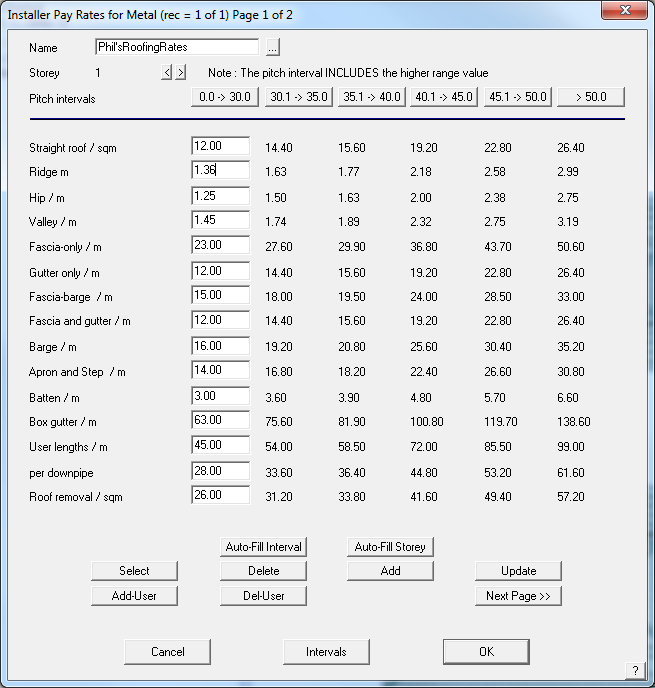
Name This is the name of this pay schedule.
Storey This is the storey to which the following rates apply. A schedule can have up to 10 storeys.
Pitch Intervals These are the pitch intervals you want to set for the job. You set them by clicking the Intervals button at the foot of the dialog. To edit a column of values you need to click on the interval value.
Line items For each line item you need to enter the rate per unit area or length for that line item. For roof removal and gutter removal only the first rate is actually read when the Reporting is performed.
Select This button lists up the existing schedules. You then select the one you want for editing. After selecting a schedule, the Update button appears letting you update the schedule.
Delete This button lets you delete the currently selected schedule.
Add This button lets you add the current schedule (schedules must have unique names).
Update Updates the currently selected table with changes.
Add-User Allows you to add any sort of labour charge that applies to walls. Each new item is given a unique index number. The example below shows a new rate for ‘Special Gutters’.

Delete User Allows you to delete a user defined charge. You will be prompted for the index number of the item to delete.
The example below shows a new rate for ‘Special Gutters’.
Del-User deletes the new rate.
Next/Previous Page These buttons allow you to toggle between the two available pages.
[Cancel] Closes the dialog box without saving the changes you have made.
Intervals Lets you define the pitch intervals you want to use – see below, Interval Labels.
[OK] Closes and saves the changes you have made.
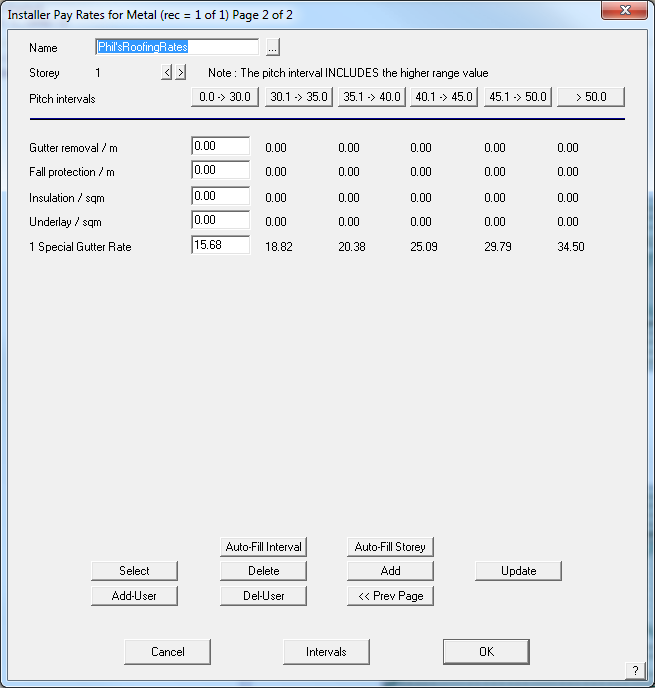
User defined pay rate for Special Gutters
Interval Labels
Customers utilising the GRIM output feature of AppliCad to link the estimation process to downstream systems have often had to create duplicate mappings of labour rates due to the output of variable labour rates in the Roof Wizard software. Outputs such as Ridge (1, 22.5) where the 1 specifies the storey and 22.5 specifies the pitch have had to create multiple mappings for each pitch gradient in 0.1 degree increments. In 8.2, we have provided the ability for each pitch interval to be given as a label (e.g. A, B, C as can be seen in the attached image) with the output therefore being Ridge (1,A), or Ridge (1,B) etc. This greatly reduced the number of mappings required, thus reducing the workload for our users and speeding up the interface between systems.

When you click [OK], the rates you defined are saved for future use. You may set up as many different files as you have different pricing for different profiles or wall systems.
GRIM File Format
A GRIM (Generic Roof Interface Method) file is designed to facilitate the transfer of roof geometry and roof material costing data between AppliCad and other computer systems such as accounting and business management or ERP systems.
Brief overview of the Generic Roof Interface Method
The process assumes that a business wants to minimize data entry and/or re-use data across the enterprise that is entered already when a job is started. The job management system may be any number of proprietary management information systems that firms have to provide some degree of control over jobs, accounts, stock etc.
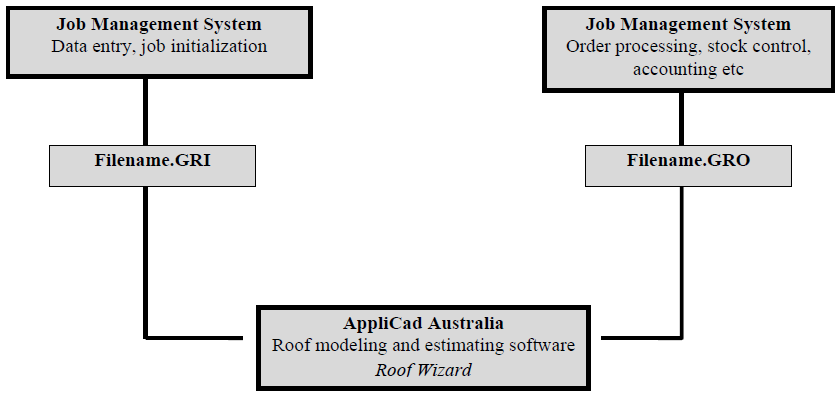
Creating the text file in GRIM format is simply a matter of writing a query in the job management system and saving the data in the appropriate form as described below. It can then be picked up by one of AppliCad’s programs (Roof X), either automatically or manually, and used without re-entering the data. AppliCad’s program models the roof geometry, automatically extracts roof details such as lengths, areas etc. and writes an output text file that may be picked up in a similar way and used by the job management system.
AppliCad’s programs do provide basic job management functions, but interfacing with advanced systems provides the tools to manage jobs at a much higher level. Typical users of this process will be medium to large roofing contractors and material suppliers that offer job lots for their clients.
The process marries up advanced job management and accounting with advanced roof modelling and take-off and closes the job management loop. Data may be created in the business’s management system and saved as a GRI file for pick up by the AppliCad application; it may also be saved from the AppliCad application for pick up by the business management system as described in the illustration below.
As it is possible that there will be much information that AppliCad creates that does not need to be shared with the business management system, a GRIM Template file can be created which filters the data exported. This delivers only the information that the business management system requires, in the order that it requires it.
The AppliCad Roof Wizard has been designed to not only model roofs but provide some job management and information sharing capabilities. The GRIM file is generated from the [Export GRIM] button on the Reporting > Supply and Install option.
A GRIM file is an ASCII file, with a header line followed by one or more lines containing a key text string and a value. A key text string is one of those defined for creating/modifying templates as described earlier in this manual.
A key text string starts in column 1 and is a maximum of 20 characters. The value for this key text string starts in column 21. For example, ###PITCH 26.6 where ###PITCH is the Key Text String and 26.6 is the pitch value.
The last line in the file is defined with ‘END’.
A sample GRIM Out File (GRO) appears below:
GRIM file header
 ###TODAY 16 July 1999
 ###JOBDELAREA Area 1
 ###JOBINSTALDATE 16 July 1999
 ###JOBPICKUPDATE 16 July 1999
 ###JOBDELDATE 16 July 1999
 ###MAPREF
 ###COMPNAME AppliCad
 ###COMPADD1 70 Railway Road
 ###COMPADD2 Blackburn Vic 3130
 ###COMPPHONE Ph 03 9878 5000
 ###COMPFAX Fx 03 9878 5055
 ###COMPACN
 ###COMPNOTE1
 ###COMPNOTE2
 ###SCALE 1 : 1
 ###PAGE Page 1 of 1
 ###PITCH 26.6
 ###EAVEOFFSET 610
 ###EAVEHEIGHT 2700
 ###RAFTERSPACE 610
 ###BATTENSZ 90x38
 ###HIPTYPE 0
 ###RIDGETYPE 0
 ###VALLEYTYPE 0
 . . .
 . . .
 . . .
 . . .
 ###TILEMAN
 ###TILECOLOUR
 ###TILEPROFILE
 ###TILETYPE
 ##TILEMATERIAL
 ###TILECOV 10.50
 ###TILEBARGECOST 0.00
 ###ROOFMAT Not included
 ###RIDGEMAT Roll top ridge, Merino
 ###FASCIAMAT Metal fascia, Mountain Blue
 ###GUTTERMAT Not included
 ###BATMAT Not included
 ###VALLEYMAT Not included
 ###BARGEMAT Not included
 ###INSULMAT Not included
 ###CROOFMAT Not included
 ###DPMAT Not included
 ###DATABASENAME Roof Wizard File : aasample.dab Model : model
 ###DATABASEFILENAME aasample
 ##DATABASEMODELNAMEmodel
 ###ROOFAREA 314.48
 ###RIDGELEN 15.50
 ###HIPLEN 47.49
 ###VALLEYLEN 13.83
 ###FASCIALEN 75.88
 ###GUTTERLEN 75.88
 ###BARGELEN 0.00
 ###FASCIABARGELEN 0.00
 ###APRONLEN 0.00
 ###BOXGUTTERLEN 0.00
 ###SHELLENDS 6
 ###APEXES 4
 END
Refer to the complete list of key text strings described here.
Repeated Structures
There are also repeated structures which handle material line items reported in the job as well as cutting list. For each material line item present in the job there is the following set of key text strings
LINEITEM the name of the line item:
###LINEITEM_SUP the supplier of this item
###LINEITEM_MAN the supplier of this item
###LINEITEM_CODE the product code of this item
###LINEITEM_PRO the profile of this item (user defined)
###LINEITEM_FIN the finish of this item (user defined)
###LINEITEM_QTY the quantity of this item
###LINEITEM_RATE the cost per unit of this item
If the line item defines straight metal roofing or flashings, a cutting list may follow. The cutting list is of the repeated
form
CUTLIST_SIZES the number of cutting list sizes to follow:
###CUTLIST_QTY the number off of the following length
###CUTLIST_LENGTH the length required
Labour line items are also written in a repeated form:
###LABOUR_ITEM The name of this labour item
###LABOUR_QTY The labour quantity
###LABOUR_RATE The labour rate
The following file segment shows this format:
LINEITEM Ridge
###LINEITEM_SUP StramitIndustries
###LINEITEM_MAN StramitIndustries
###LINEITEM_CODE RTRVCTL--
###LINEITEM_PRO Roll top ridge
###LINEITEM_FIN Merino
###LINEITEM_QTY 2.000000
###LINEITEM_RATE 10.280000
###CUTLIST_SIZES 6
###CUTLIST_QTY 1
###CUTLIST_LENGTH 3200
###CUTLIST_QTY 4
###CUTLIST_LENGTH 2950
###CUTLIST_QTY 6
###CUTLIST_LENGTH 2840
###CUTLIST_QTY 4
###CUTLIST_LENGTH 2800
###CUTLIST_QTY 6
###CUTLIST_LENGTH 2720
###CUTLIST_QTY 2
###CUTLIST_LENGTH 2300
A material cutting list similar to that shown above is written if the name of the line item is one of:
‘Straight roofing’,
‘Ridge’,
‘Valley’,
‘Fascia’,
‘Gutter’,
‘Barge’,
’Apron’, or
‘Batten’.
The GRIM-In Process
If the GRIM in process is to be used, the operator must tell the software that it should look for GRIM In files to be read at start-up. This is done by selecting the option through the Set-Up > Preference Settings > System Preferences dialog. Select the button, ‘Import GRIM File on Start-Up’ to toggle it to Yes.

At start-up the AppliCad software will look for any files with a *.GRI extension. The operator selects the required GRIM file and all data that has been set up at the business management software end will automatically populate the appropriate fields in AppliCad.
This minimises data entry and potential errors in transcribing information from the order form to the software.
The GRIM-Out Process
The GRIM out process is initiated from the Reporting > Supply Only or Reporting Supply and Install dialog box.
ExportGRIM This allows you to write the current job as a GRIM file. If you have given this job a quote number then the name of the grim file is <Quote Number>.GRO. If you have not, the name of the grim file is GrimFileOut.GRO.
You also get separate grim files defining the materials required from each supplier. These are named Order-<Job Number>-<Index>.GRO.
A plot file of the roof plan is also exported in HPGL format that may be used to illustrate reports in other systems. It is saved as GrimOutFile.plt into the …\User folder.
A TIFF bitmap image file is also created. If a job number exists, then the file is called Job#.TIF. If no job number is defined, then it is called GRIMOUTFILE.TIF.
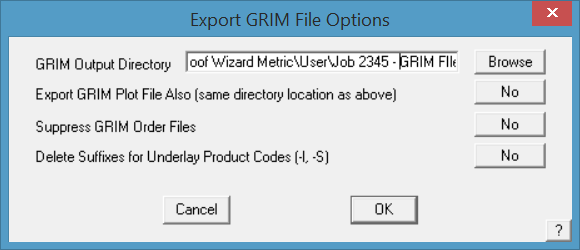
Selecting Export GRIM brings up the GRIM File Options:
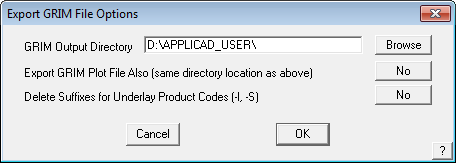
Select the required path for the file. This may be a dedicated path where you have set up a utility program to look for newly created files for processing, thus automatically taking the GRIM data and processing it for use in an external program such as business management or inventory management software. The *.GRO file is written to the specified folder as described above.
Select [OK] and the following dialog is displayed. You may also set which quotes to output, if multiple have been created, and exclude zero quantity items if there are any.
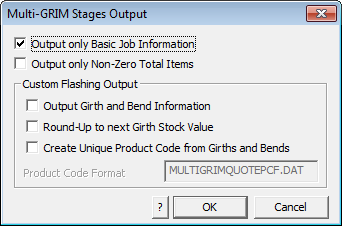
Select the options you require and select [OK] to write the GRO file to the specified folder.
GRIM Roof Plan Picture (Plot File)
When you export a grim file, a plot file is created of the roof plan. The plot file is an ASCII vector format that conforms with Hewlett Packard Graphics Language 2 (HP-GL2) – this is a generic format used to drive Hewlett Packard plotters. Lines and line properties are plotted as defined by the operator using the Tools > Change Entity > Lines Styles option. Essentially what you see on screen is what will be plotted to the HPGL2 file. Sarking or Underlay planes (where there is partial Underlay) appear as filled planes.
The HPGL2 file format is an ASCII text file, which means the instructions may be viewed in a text editor and an importation routine may be easily written for custom applications where the roof plan needs to be displayed. Many word processors and graphics programs will import HPGL2 files directly. You may need to install specific functions to enable this feature.
A TIFF bitmap image file is also created. If a job number exists, then the file is called Job#.TIF. If no job number is defined, then it is called GRIMOUTFILE.TIF.
The TIF file output can be controlled using various options in the text file TIFFOPT.DAT so that the TIF images meets you subsequent use of the file – to illustrate the job in a database for example.
An example is shown here:
;xSize ySize xDPI yDPI
1200 700 150 150
;Coursed (1=Yes, 0 = No)
0
;Planes (1=Yes, 0 = No)
1
;Black & White (1=Yes, 0 = No)
0
GRIM Template Files
This feature gives the user a method by which a user defined data file can be generated with specific data included as part of the output file, effectively working as a GRIM file filter. This would be most useful in transferring exactly the required data from Roof Wizard to other systems.

A Grim Template file is an ascii file with a ‘.grt’ extension. The file contains grim text strings which are swapped over for their current value when you do an ExportGRIM from the Reporting > Supply Only or Reporting > Supply and Install dialog box.
An example format data file would be something like the following:
My header line
###JOBNUMBER , ###JOBQUOTE ,###TAX, ###TOTALINCTAX
This is some sample text
If you called this file MyGrim.grt, the result would be a file called MyGrim-data.csv with the actual values.
My header line
jn-8888 , qn-9999 ,224.36, 2467.95
This is some sample text
You can have up to 5 grim template files in your user directory and up to 10 lines in the *.grt file.
Using the GRIM File with Pitch Intervals
Customers utilising the GRIM output feature of AppliCad to link the estimation process to downstream systems have often had to create duplicate mappings of labour rates due to the output of variable labour rates in the Roof Wizard software. Outputs such as Ridge (1, 22.5) where the 1 specifies the storey and 22.5 specifies the pitch have had to create multiple mappings for each pitch gradient in 0.1 degree increments.
Roof Wizard now provides the ability for each pitch interval to be given as a label (e.g. A, B, C as can be seen in the attached image) with the output therefore being Ridge (1,A), or Ridge (1,B) etc. This greatly reduced the number of mappings required, thus reducing the workload for our users and speeding up the interface between systems.
Multi-GRIM-Out
The Multi-GRIM option lets you generate a single GRIM file containing a breakdown of details based on each stage in your current job. You must have defined one or more stages using Stage Manager to continue with this command.
This command also works in a similar manner to Mutli-Grim Stages but will break down the details based on each Quote Group defined.
Multi-GRIM for Stages
(Pulldown Menu)
This command lets you generate a single GRIM file containing a breakdown of details based on each stage in your current job. You must have defined one or more stages to continue with this command.
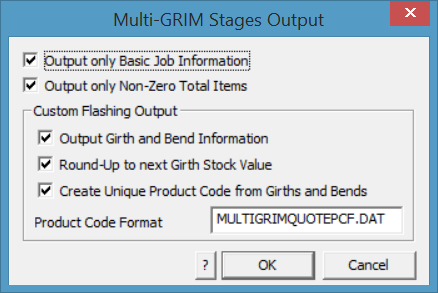
The resultant gro file has each stage braced between a STARTSTAGE-ENDSTAGE pair. A sample file looks like this:
GRIM file header
STARTSTAGE
###STAGENAME Main roof
###STAGEINSTALLER Benny the builder
###STAGEINSTALLDATE 12 February 2001
###STAGEDELDATE 12 February 2001
###TIME 14:32:33
###TODAY 12 February 2001
…
ENDSTAGE
STARTSTAGE
…
ENDSTAGE
END
A plot file for each stage is also written. The format for the plot file is:
Order-<job number>-<supplier index>-<stage name>.PLT
Multi-GRIM for Quotes
(Pulldown Menu)
This command works in a similar manner to Mutli-Grim Stages but will break down the details based on each Quote Group defined.
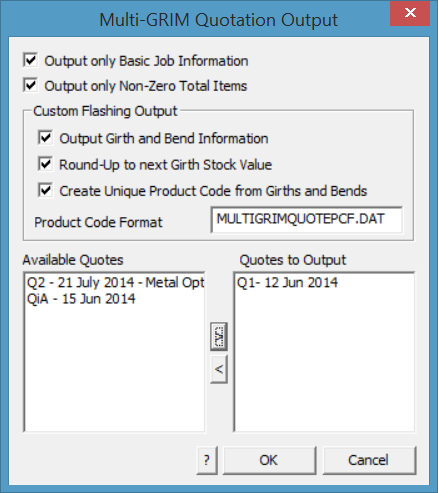
Note that a feature is available to control what happens with Custom Profile Flashings where a product code is not normally allocated as each profile can be unique, based on different girth and/or number of bends. The GRIM file can be made to automatically create a product code using the girth and bends information.
![]()
Note: For the generation of the product code based on Girth and Bends there are a couple of things that MUST be checked and changed if necessary.
- The definition of the Flat Sheet for the fabrication of the Custom Profile – the Alternate Category must be left blank, or set to Fabrication (which is the default if left blank). Refer Help > Setup.
- You must have a MultiGrimQuotePCF.dat in the ..\User folder as described below. This sets the format of your Line Item product code to include the Girth and Number of Bends.
- You must also have a settings file in ..\User telling the software what file is used to define the format of the product code as referred to in #2. This file saves the settings of the dialog box and in particular the file name referred to in #2. This file must be called MultiGRIMQuote.dat. (The expectation is that the Dialog box is supposed to save this for you, but you need to check and if not there, put it there yourself using Notepad )
- Check that the supplier name used in the MultiGRIMQuotePCF.dat matches the actual supplier names used in the definition of your Flat-Stock.
You create a text file that controls the format of the product code for each Custom Profile, and the Supplier name must be the same name as used when you defined the Flat Stock. You may use spaces between each key text string item. The text file must be called MULTIGRIMQUOTEPCF.DAT and be in the form of:
Supplier1
###CODE-###BENDSx###GIRTH
Supplier2
###GIRTH x ###BENDS, ###CODE
This would result in a line in the GRIM file that might look like this:
Supplier1, CUSTOMType#1-5×300
….
And then the balance of the cutting list for this item called CUSTOMType#1, 5 bends and 300mm girth, the the details for the second supplier’s material order (if you have multiple suppliers of custom profile trim).
His order would look like this:
Supplier2, 300 x 5, CustomType#1
…..
And then the cutting list for this item.
Repeated as required for all Suppliers in the Flat Sheet product list.
Report Templates – Microsoft Word/Excel
Objective: To design or customize the report templates to suit your individual needs.
![]()
Note: This section may appear to be quite a daunting process at first as it requires use of many of the standard 3D CAD functions rarely used when modelling roofs and generating estimates. If also requires extensive knowledge in the use of MS Word and Excel, if they are to become your standrad report generators. We suggest you are very familiar with the workings of the respective software before returning back to this point.
There are two distinctly separate processes for creating report templates from AppliCad software. The CAD template (what we have used for 25 years and still support), and the seamless integration with MS Word or MS Excel for report generation.
When output reports are created by the software, it first looks for a Microsoft Word template of the required name form, for example QuotationLetter. The file it is looking for must be saved in the ..\User folder or ..\Corporate and must have the name of QuotationLetter.DOC without spaces as a Word Document or QuotationLetter.DOT as a regular Word Template document.
The file format must be Microsoft Office 1997 – 2003 compatible – that is, no XLTS or DOCX formats. This ensures backwards compatibility for all users.
If the software finds the DOC or DOT by the defined name, it will use it. If it does not find a Microsoft Word template, it will use the AppliCad default CAD template for QuotationLetter which is saved in the AppliCad database file, RoofWiz.dab. This will ensure that all your existing default CAD templates will work as they do now when the software is updated by new releases.
Creating a template in MS Word allows for more creativity in design and many operators may be more familiar with Microsoft Word than the CAD functions. The use of Word Templates is described later in this section. Using a Word template, you can have as much or as little information as you require for your projects. If you plan to use Word templates exclusively, you might consider going direstly to that section below, however, a lot of useful information is described in the CAD template section.
Setting Up MS Word/Excel as your Report Generator
This section describes the use of Microsoft Word/Excel to create templates. It is not a Microsoft Word/Excel tutorial – it assumes moderate to high level of competency in the use of Word/Excel.
The first thing to understand is that the software will use the default report templates created in the CAD software if no Word or Excel template exists. This is necessary to ensure that existing operators can continue their use of the software without interruption because of a new reporting template options.
At any stage you may decide to use Word or Excel as your template editor and if the software finds a Word or Excel template, that template is used INSTEAD of the default CAD template. Over time, we believe that the MS Word template will be the preferred option because of the greater flexibility of the design elements that it affords the user.
The standard CAD template names will be maintained throughout as described below:
| Report name | Template name | Intended Use |
| Quotation letter | QuotationLetter | A quotation to send to your customer detailing the information as a letter |
| Quotation form | QuotationForm | A quotation to send to your customer detailing the information in a tabular fashion. |
| Quotation acceptance | QuotationAcceptance | Same as above with the addition of a place for the customer to accept the quote with a signature |
| Quotation details | QuotationDetails | This report tabulates the materials and costs for the job |
| Installer pay summary | PaySummary | This report tabulates the labor costs for you to perhaps give to the installer |
| Material cutting list | MaterialCuttingList | This report tabulates the sheet and flashing cutting lists |
| User form 1 | UserForm1 | An extra form for you to define |
| User form 2 | UserForm2 | An extra form for you to define |
| User form 3 | UserForm3 | An extra form for you to define |
| User form 4 | UserForm4 | An extra form for you to define |
| Order Forms | OrderForm | The Supplier’s Order form. Generated for each supplier in your list of required items. |
| Tax invoice 1 | TaxInvoice1 | A tax invoice |
| Tax invoice 2 | TaxInvoice2 | A tax invoice |
| Bill Of Quantities | BillOfQuantities | A Bill Of Quantities report |
| Roof Quantities | Roof Quantities | Summary of roof geometry (areas and lengths) and a roof plan |
Do not add new templates or change the order of this list. If you add new template options, add them below the standard report templates.
The important difference in the process is that you create a report template using Microsoft Word or Microsoft Excel that suits your needs. You will save it as a Word template or Word document and use the default CAD template name and that will be used instead.
That is, QuotationDetails will be saved as QuotationDetails.DOT (Word template file) or QuotationDetails.DOC (Word document file), without spaces; QuotationLetter will be QuotationLetter.DOT etc. Most of our users prefer a *.DOC file because MS Word imposes extra controls on *.DOT files that we don’t need and sometimes these get in the way of progress. If created in Excel they will be saved as QuotationDetails.XLT (Excel template file), or QuotationDetails.XLS (Excel spreadsheet file).
These files must be saved in the …\User folder for local use or the …\Corporate folder for wider company use. The file format must be Microsoft Office 1997 – 2003 compatible – that is, no XLTS or DOCX formats. This ensures backwards compatibility for all users.
Linking Templates to Output
You can however create any other report template with any name so long as these names are listed in the text files called UserReportNames.csv and UserDrawingNames.csv . The software needs to know that you have created a new template, what it’s called, and how you wish to refer to it.
UserReportNames.csv is where the preset template names for CAD and Word/Excel Report Templates are associated with the reporting output process.. This allows any template form/report to have any name when displayed in the print options list. Column A is the name you wish to have in the [Print] options list. Column B is the actual file name in the ..\User folder when viewed in Excel.
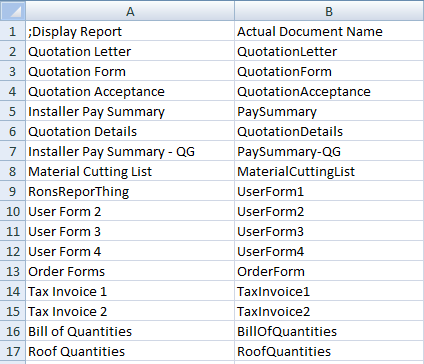
![]() Note – The order of these standard reports is set – do not change the order.
Note – The order of these standard reports is set – do not change the order.
Also do not add your new report template names above this standard list. Add them below this list.
UserDrawingNames.csv is where the preset template names for both CAD and Word/Excel Drawing Templates are associated with the drawing output process. This allows any template form to have any name when displayed in the print options list. Column A is the name you wish to have in the Print options list. Column B is the actual file name in the ..\User folder. For drawing output as distinct from report output, you need to tell the software what sort of drawing it is so that th ecorrect information is automatically included, without you having to do any further work in generating the report. This is done in column C using the code number as required.
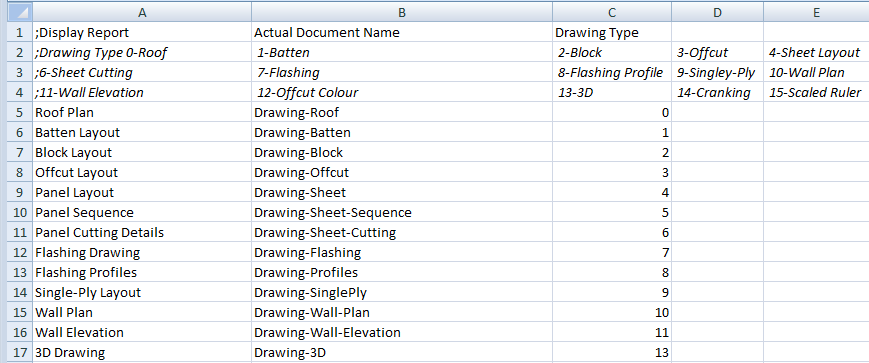
Once a new template has been created, and saved to the …\User folder, it can be added by simply going to the Tools > More > Edit User Templates option.
The complete list of both CAD templates and Word/Excel templates is displayed.
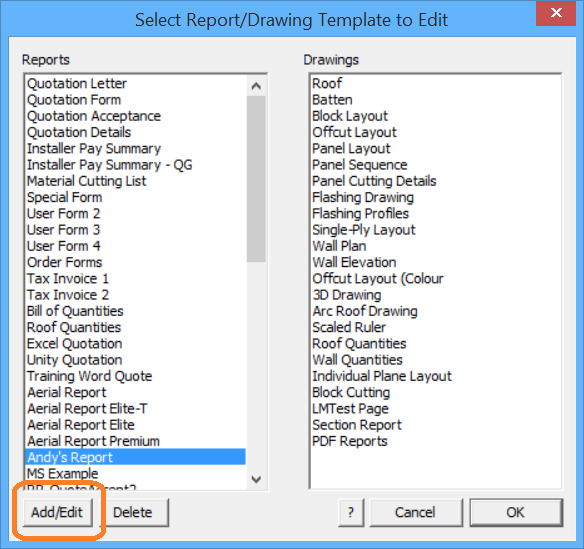
To add your new Word template to the list, select Add/Edit and the Edit Report dialog is displayed that provides for you to add the new report name (as you want it to appear in your print options list) and then select the name of the actual template file by selecting the […] button (for Word or Excel) or subfigure name ([Figure] if it is a CAD template).
![]() The Word or Excel templates must be saved as a *.doc or *.xls (the older format) to ensure backward compatibility, and located in the ../User folder. Do not save in sub-folders or on your desktop or anywhere else or the software can’t find them and the reporting process stops.
The Word or Excel templates must be saved as a *.doc or *.xls (the older format) to ensure backward compatibility, and located in the ../User folder. Do not save in sub-folders or on your desktop or anywhere else or the software can’t find them and the reporting process stops.
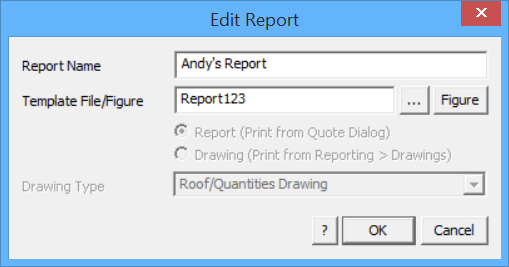
Select [OK] and the new report template is linked and available in your print list. If it is a drawing template, the extra option is displayed to set what type of drawing output you require. This sets the drawing annotation that is appropriate for that drawing.
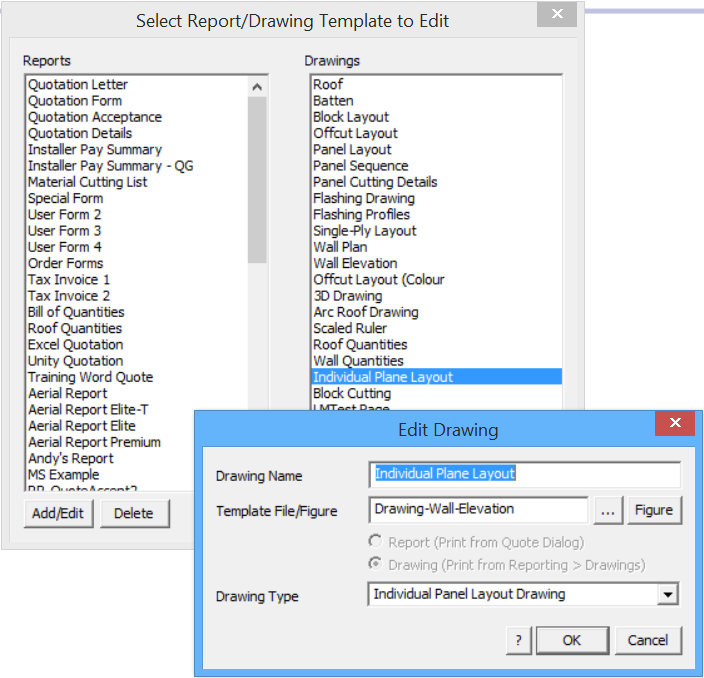
Note – The insertion of images into Excel reports has been modified to create the bitmap within the Excel file as an independent image, not linked via the original image from the …\User folder. This prevents the image from being changed and ensures report integrity.
Define Print Options
Tools > More… > Define Print Options (Pulldown menu only)
Once the report templates are designed and added to your list, you also have an option to pre-set the reports that are printed by default. This saves you the extra step of selecting them over and over.

Once set, select OK and next time you go to print your job reports, you simply select [OK] and it all just happens.
Designing your Own Templates
The process that the software uses with either AppliCad CAD templates or Word/Excel templates is the same – we use regular text and what we call Key Text Strings (KTS). The illustration below shows the different application of the two types of text – ‘Date’ is regular text; ‘###Date’ is a Key Text String.
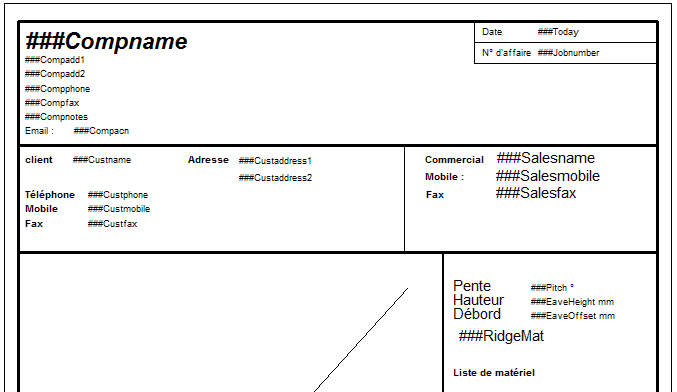
Regular or normal text – no ### signs Key Text String – with ### signs
The first thing you must do is decide what needs to be on your report. The starting point for that would be what you currently use to supply a proposal to your client. Look at the content and the layout. Consider what works now and what has been deficient in the past. Use this opportunity to revamp your proposals.
Now decide what is ‘regular text’ and type this onto your Microsoft Word/Excel document using the layout and composition functions of MS Word.
Next type in the Key Text String for the variable you need the software to insert when it creates the output report. There are 100’s of key text strings variables for you to use.
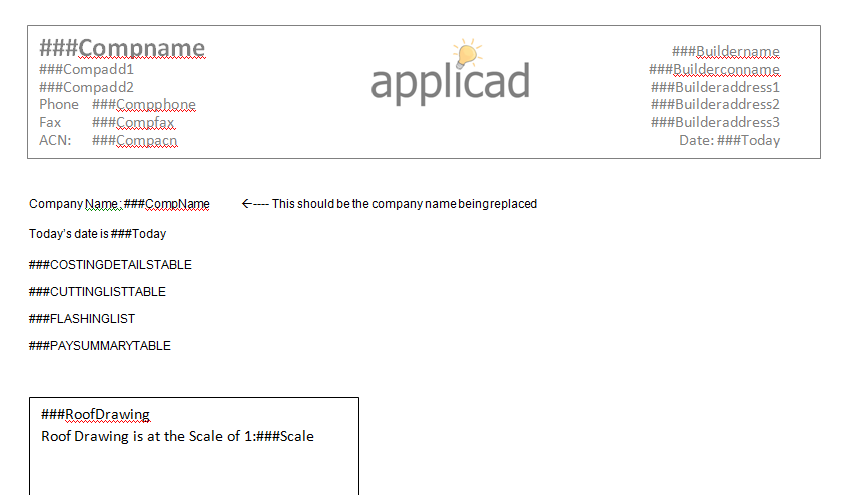
Note that Word templates allows the use of Headers and Footers and multiple graphics files such as logo’s etc. The best layout will come after some experimentation, so try all the options that come to your mind.
A complete list of all Key Text Strings is here.
The same process with templates is used to define the templates for the various roof drawings that typically form part of the client’s proposal. These are listed below:
| Drawing name | Template name | Intended Use |
| Roof drawing | Drawing-Roof | Shows the roof |
| Batten drawing | Drawing-Batten | Shows the battens on the roof |
| Block Layout | Drawing-block | Shows the blocks on the roof as created by Auto-Block |
| Offcut Layout | Drawing-offcut | Shows the cuts and offcuts created by Gen-OffCuts |
| Offcut Layout (Colour) | Drawing-offcut-colour | Shows the cuts and offcuts created by Gen-OffCuts using coloured planes that aid in offcut placement. |
| Panel Layout | Drawing-sheet | Shows the sheets on the roof as created by Gen-Sheets |
| Panel Sequence | Drawing-Sheet-Sequence | Shows the sequencing of panel cutting derived from Linear nesting |
| Panel Cutting Details | Drawing-Sheet-Cutting | Shows the detailed dimensioned panels |
| Flashing Drawing | Drawing-flashing | Shows the roof and dimensions for each roof line as detailed by Dimension-Roof Lengths |
| Flashing Profiles | Drawing-Flashing-Profile | Details the workshop drawings for the fabrication of custom flashing profiles |
| Single-Ply Layout | Drawing-SinglePly | Shows the membrane layout generated by Cover Select-Membrane Layout-SinglePly |
| Wall Plan | Drawing-Wall-Plan | Shows the wall layout |
| Wall Elevations | Drawing-Wall-Elevation | Shows an elevation drawing of each wall |
| Arc Roof Production Drgs | Cranking.DAB | Details the workshop drawing for the fabrication of cranked panels |
| 3D Design Drawing | Drawing-3D | ISOmetric view of roof in 3D |
| Scaled Ruler | Scaled Ruler | A drawing that allows you to scale from drawings with unusual scale factors. |
| Individual Plane Layout | Drawing-Wall-Elevation | Prints each roof plane and its panel layout (using the wall plane template) |
| Block Cutting | Drawing-BlockCutting | The block-cut details layout drawing |
![]()
Note: It will also help you a lot to preview AppliCad’s standard report templates as described above before you edit or design your own, especially the roof drawing reports as they do have particular needs that will become apparent upon review.
There is a significant difference between the AppliCad default CAD template and the Word template and that is with the placement of the thumbnail of the roof plan into the report. To get the roof plan (with or without dimensions) into the Word report, you must create a ‘text box’, a ‘shape’ or a ‘table’ in Word, and add the Key Text String for the required roof drawing, such as ###RoofDrawing into the shape, table or text box.
Before the roof plan is inserted into the report, AppliCad creates a separate file of the roof drawing called RoofDrawing.eps (a postscript vector format print file) based on the current view of the 3D model, that is at the time you go to the Reporting > Supply and Install screen, and select [Print].
This is fundamentally different to the way the roof drawing is placed using the CAD report when it is generated from the CAD template.
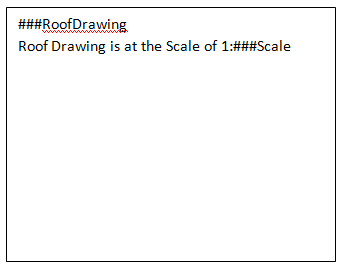
The Text Box essentially defines the extents of the roof drawing on your template. If you wish to constrain the roof drawing to a particular scale (so that you may actually check measurements from it, you insert the Key Text String for the scale) controlled as required by the process described below.
If the scale of the roof drawing is not relevant and you simply require the largest possible drawing, use the key text ###UnscaledRoofDrawing and the roof drawing will be placed inside and constrained by the text box or cell, the roof drawing will maintain its aspect ratio.
Refer below for more options with inserting the roof drawing into a MS Word template.
![]()
Important Note: As of the April 2017 Windows 10 product update, Microsoft disabled the ability to insert Encapsulated PostScript (EPS) graphics into Office documents in order to address a known vulnerability with Windows and make MS Office more secure.
It happens that the ###RoofDrawing uses an EPS file to get the roof plan from Roof Wizard to MS Word. Without that translator, the Roof Wizard crashes. We have a FAQ tip to re-instate the EPS translator here.
However, AppliCad recommends that you change your template(s) so that the EPS translator is no longer required. To do this remove ###RoofDrawing from all your templates and replace with ###RoofImage[n]. THIS IS THE BEST LONG TERM SOLUTION.
More details about how to take advantage of the ###RoofImage[n] are described in the next section.
Apart from over-coming the Windows/EPS issue, it provides a lot more flexibility to how you present your roof plan.
Managing Content of Report Images
For all standard reports the ###RoofDrawing will usually be sufficient. However, with new developments, the operator can now control the appearance of the attributes of the roof as they appear on the report using ###RoofImage[n]. The key text string for the roof image MUST be placed in a text box in single cell table in MS Word or a text box in a cell in MS Excel to work correctly and the size of the single cell table will determine the size of the image. Failure to insert in a MS Word single cell table may cause the software to crash.
The key text string for this option allows the operator to control the level of annotation applied to the roof drawing. For example, you might require dimensions, roof slope/pitch and Line types. This can be achieved by setting the ‘switches’ as shown below, in the combination that you require for the desired output.
The following list summarises what is included on the drawing of the roof model.
Additional annotation Switch
 1 -  Roof planes (1 = on, 0 = off)
 2 -  Display Walls (2 = on, 0 = off)
 4 -  Panel layout/Block layout/Offcut layout (4 = on, 0 = off)
 8 -  Dimensions (8 = on, 0 = off)
 16 - Roof Pitch/Slope (16 = on, 0 = off)
 32 - Line type (32 = on, 0 = off)
 64 - Flashing annotations (64 = on, 0 = off)
 128 - Battens/Purlins (128 = on, 0 = off)
 256 - Course lines (256 = on, 0 = off)
 512 - Downpipes (512 = on, 0 = off)
 1024 - Section Details Report (1024 = on, 0 = off)
 2048 - Block-Cutting (2048 = on, 0 = off)
 4096 - Roof plane areas (4096 = on, 0 = off)
 8192 - Display defined Zones (8192 = on, 0 = off)
 16384 - Display Automated Roof Plane Labels (16384 = on, 0 = off)
 32768 - Not Used
 65536 - (for ###RoofImage and ###WallImage only) allows rotation of the image to best fit the text box, otherwise not.
To get the desired combination you add the value of the switches together. So if you wanted to reproduce a roof drawing on your report that included pitch and dimensions n=8+16=24, and your key text string would be ###RoofImage[24].
For flashing annotation and downpipes on the same roof drawing, n=64+512=576 and the key text would be ###RoofImage[576].
In the example below we have roof planes, walls, panel layout, dimensions, battens and downpipes you would need n=1+2+4+8+128 + 512 = 655 – ###RoofImage[655]
RoofImage[655]
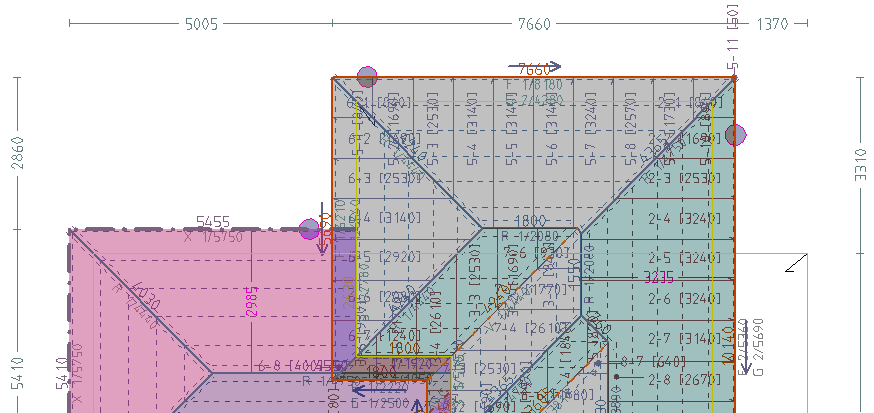
All the required information must already have been placed on the 3D model, and this would normally be the case during the development of your job.
The exception to this are pitches/slopes and linetypes, as these are normally not left with the model, they typically only used during checking. If they are not in the model and you select them for the report, they will be added for you before it processes the key text string.
This provides a lot of additional control over the appearance of your reports and the level of detail you wish to provide your customers and installers. You can go simple with ###RoofDrawing or complex with ###RoofImage or ###RoofImageC – the ‘C’ denotes constrained as it will not auto-rotate.
Before the roof plan is inserted into the report usng ###RoofImage(n), AppliCad creates a separate file of the roof drawing called RoofImage.TIF (a bitmap image file) based on the current view of the 3D model, that is at the time you select the Reporting > Supply+Install screen, and select [Print].
![]() If you want a plan view, have plan view displayed. If you want perspective or ISO view, select those views BEFORE you select Reporting > Supply+Install.
If you want a plan view, have plan view displayed. If you want perspective or ISO view, select those views BEFORE you select Reporting > Supply+Install.
WallImage[n] works in the same way for creating wall reports. the operator can now control the appearance of the attributes of the wall as they appear on the report using ###WallImage[n] where n = the ‘switches’ as shown below, in the combination that you require for the desired output, in the same manner as described above for the roof report.

1 – Display the Wall Plane Shading (1 = On, 0 = Off)
2 – Display Wall Panels (2 = On, 0 = Off);
4 – Display the Wall Dimensions (4 = On, 0 = Off)
8 – Display the Wall Line Types (8 = On, 0 = Off)
16 – Display Flashing Annotation (16 = On, 0 = Off)
32 – Display Wall Battens/Purlins (32 = On, 0 = Off)
64 – Display Wall Section Details (64 = On, 0 = Off)
128 – Display Wall Plane Areas  (128 = On, 0 = Off)
256 – Display Overall Dimensions (256 = On, 0 = Off)
512 – Display Automated Wall Plane Labels (512 = On, 0 = Off)
1024 – Display Automated Wall Plane Labels including Windows & Doors (1024 = On, 0 = Off)
2048 - Display Automated Window & Door Labels Only (2048 = On, 0 = Off)
65536 - (for ###RoofImage and ###WallImage only) allows rotation of the image to best fit the text box, otherwise not.
These are usually used in conjunction with a wall section report using one of the key text strings for the style of report that you require, and may include an isometric view of the structure, automatically. Experiment with the various key text strings to find the style that works for you, or contact the AppliCad support team for advice.

Auto-Rotate View
The program utility that combines the various roof drawings with the Word report template looks at the style the target document and will perform additional functions as required. It only works with Word templates. The view of the roof may be inserted into the Word design elements of table, text box or shape.
The key text ###RoofDrawing will scale as required, but will not rotate the model image. It will be auto-scaled to the size of the shape or text box unless otherwise controlled as described in the preceding section.
If you decide to place a table element into the Word template to define the placement of your drawing detail you must set the height AND width of the table cell to suit your template design. All drawing types (other than ###RoofDrawing), such as ISORoofDRawing, sheet layout or flashing layout etc, the software will auto-scale and auto-rotate to best fit the extents of the defined cell.
If you use Word design elements such as shapes (typically rectangular) or a text-box, the drawing will auto-scale, but NOT auto-rotate. These are limitations of MS Word and not anything AppliCad can control.
Scaling the Roof Picture
Any CAD report or CAD drawing that incorporates a picture of the roof, draws the roof to best fit between the extents of the diagonal line input on the template on layer 999. Refer to the section of the manual dealing with defining CAD templates. The roof picture may be further constrained by a ‘proper’ scale factor so that the picture may be compared with other drawings of known scale. For example the best fit across the page might be 1:187. This cannot be compared to anything useful, so the software automatically adjusts this scale to 1:200 if that is one of the scale options that you have set.
The range of scale options is defined in the software and these scales are 10; 20; 50;100; 125; 150; 175; and 200.
The operator may also define any other scale options. This is done by defining a series of scale values in a simple text file. The file must be called Scales.dat; it must be in the ..\User folder and be in the form of:
50
100
115
125
150
165
175
200
END
The word END at the bottom of the list is essential for it to work properly.
You may also have the roof picture included totally within the entire text box at what would essentially be a random scale and for this you use the Key Text String of ###UnscaledRoofDrawing.
Inserting Bitmap Images
A further option exists to place bitmap images into the report. These may be constrained to the original proportions of the image or adjusted to fit the text box it is inserted into. The images must be saved in the operator’s \User folder and be of a prescribed name that matches the name used in the template.
We may also place selected image files into a report template. For example, as shown below we have a place marker in the text box for two images ###Image[East.jpg] and ###Image[West.jpg]. The appropriately named images from the …\User folder will be automatically inserted to fully fit the size of the text box adjusting the proportions to fit the space. This may distort some image files and should be taken into account.
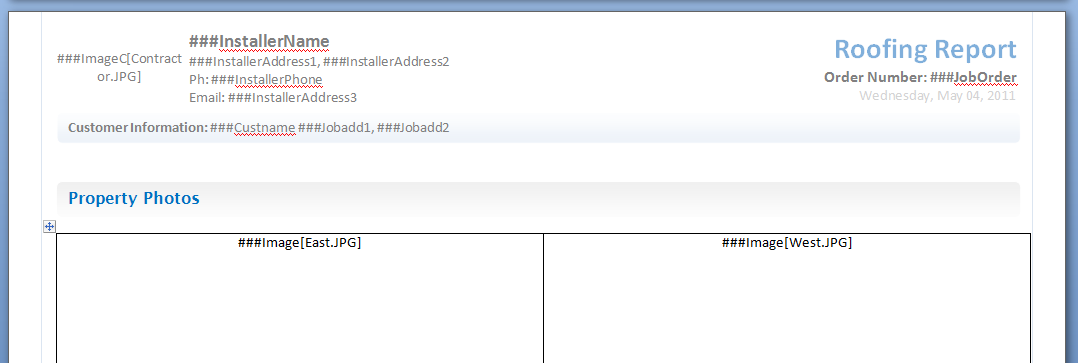
Using the key text ###ImageC[filename] – the letter C designates that the image is to be constrained to the original proportions. This is important for dimensioned roof drawings.

This may also be used to place customer logo’s and other fixed size graphics into a report – such as Contractor.jpg is the contractor customer logo. This bitmap image must also be saved in the …\User folder and have a fixed prescribed name.
Images and drawings may also be placed in the header and/or footer of the Word template.
A quick and convenient way to insert images of your roof model or plan drawing into any document is to capture them from the screen using the Tools > Export Image from Screen function.
The first thing to do is set up the model on screen to display precisely what you wish to see in the report. A good example might be the 3D Isometric view (although a ket text string will do this automatically).
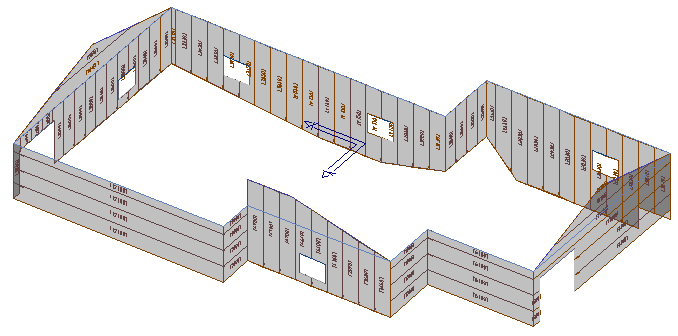
Then select the command – Tools > Export Image from Screen. You will be prompted for a file name. This should be the same name that you have used in the creation of the template – for example, 3D-Iso-View.jpg.
Select [Save] and a bitmap file is saved to the …\User folder. Your template should be created with the appropriate key text string to automatically transfer this exact image to the report.
In this example, the key text would be ###ImageC[3D-Iso-View.jpg]. When the report is run, the image will be collected by the program and placed into the Word template for you. You can create as many of these as you need to illustrate your reports. The name of the file must match the name used in the key text.
![]() Note – the program will go off and find any file with the name specified in the …\User folder. If you forgot to create one for the the current job, or you didn’t need that particular view, the software will still go looking for the file (because it is in the template) and if it finds one, even though it may be from a different job, it will still insert it into the report.
Note – the program will go off and find any file with the name specified in the …\User folder. If you forgot to create one for the the current job, or you didn’t need that particular view, the software will still go looking for the file (because it is in the template) and if it finds one, even though it may be from a different job, it will still insert it into the report.
To place other details into the report automatically, you can create models in the job database that contain the required information, such as a pitch diagram or roof azimuth diagram. Once the information is inserted on the roof model it must be saved with a model name that describes what the model is displaying. The standard options are summarised below:
| Model Name | Displayed information | AppliCad Function |
| AREAS | Roof area dimensions | Tools > Dimension > Roof Plane Areas |
| GRID | Planning GRID | Render > Insert Roof Grid |
| AZIMUTH * | Azimuth of roof planes | Tools > Diemsion > Insert Roof Azimuth |
| INSOLATION * | Solar radiation map | Render > Generate Insolation Map |
| LENGTHS | Lengths of roof features | Tools > Dimension > Insert Roof Lengths |
| PITCHES | Pitch of each roof plane | Tools > Show Pitches |
| SHADOWS * | Shadow map | Render > Generate Insolation Map (shadow palette) |
* Available options, only if you have the AppliCad Solar Wizard module installed
The various models defined during the process of modelling the job are converted to an EPS format file by the AppliCad software, Word is opened automatically and the EPS file placed into the report by the program. Microsoft Word/Excel must be installed on the computer where the reports are to be generated.
Below shows an example of the MS Word/Excel template showing the key text string for adding the LENGTHS model data into the report. Use the same process for adding any of this model data to a report.

Complete a report template with details such as a GRID diagram or shadow map or an insolation map (only if you have AppliCad’s Solar Wizard modules installed).
![]() Note: For those people designing forms for use with foreign languages, regular text can be in whatever language you use, but Key Text Strings MUST be exactly as defined by AppliCad; as shown in the example in the previous page.
Note: For those people designing forms for use with foreign languages, regular text can be in whatever language you use, but Key Text Strings MUST be exactly as defined by AppliCad; as shown in the example in the previous page.
Image ‘Padding’ – There are also situations where the image needs more ‘space’ around it to fit neatly inside the table cell and not be clipped or truncated. If you find that your images are being clipped, you can change the setting in a file called “ImagePad.DAT” in the user folder. The default setting is 1000 (1 metre) around the image before it is scaled and placed in the table. You might need to stretch this a bit depending on your system setup. Experiment to get the desired output. Not that if you increase the image “padding” your roof image gets smaller, making the text harder to read. So getting this right for your setup is a balancing act of sorts.

Changing the padding from 1000 to 4000 results in more space, but smaller text.

How it All Works
A report template may be a Word DOC or a Word template; an Excel XLS or an Excel template. If a Word/Excel document template exists in the user folder, say QuotationLetter.DOC designed by the operator to suit the needs of the business, the AppliCad software will use this template as the basis of the report instead of the default AppliCad CAD template.
When you select Print from the Supply Only dialog or Supply+Install dialog
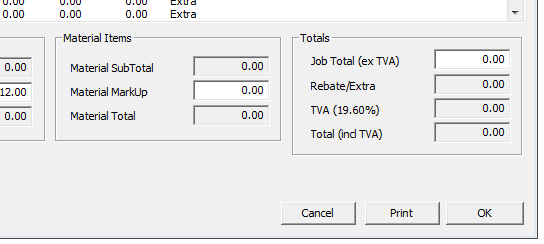
The process pulls up the list of report options. The list or reports available is on the left hand side of the box and to move the required reports to print, double click it or select it and then click the [>] arrow button.
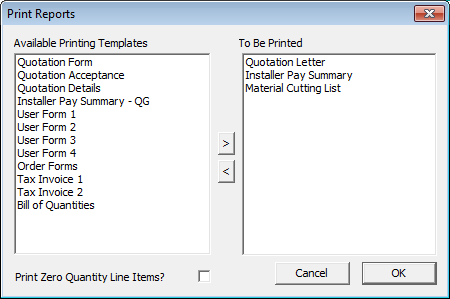
Select [OK] and the process begins. Depending on the settings in the System Preferences you have set Microsoft Word will be displayed and show the form being completed and a print dialog may also displayed, providing the opportunity to select one of your network printers.

Part of the Preferences dialog where you set the printer and display options for showing what Word is doing as it does it.
As each variable is determined by the software, the progress is also displayed in a dialog on the AppliCad screen. This confirms that the process is working correctly.

Once the report has been created, you are prompted to select the printer to print to, or it automatically prints to your default printer.
If the report subsequently consists of multiple pages they will all print one after the other.
At the same time a Word/Excel document is created that may be reviewed and or modified and reprinted at any time. The Word/Excel document is created with a name that consists of the AppliCad file name, a dash then the AppliCad model name in that file and another dash, then the form name for example QuotationLetter.
So a job saved in AppliCad as BillsRoofing.DAB and the job is called 12HighStreet, the Word document will be called – BillsRoofing-12HighStreet-QuotationLetter.DOC.
It will be saved to the ..\User folder.
![]() Note – In general, MS Word processes the key text strings by first searching the document, then headers and footers, then text boxes and lastly shapes. As it encounters each key text string, the substitution of the real value is made. You can observe this if you have Word open when you run the report prior to printing.
Note – In general, MS Word processes the key text strings by first searching the document, then headers and footers, then text boxes and lastly shapes. As it encounters each key text string, the substitution of the real value is made. You can observe this if you have Word open when you run the report prior to printing.
Word Table Formats
Microsoft Word has an amazing set of tools for creating and using tables and AppliCad makes use of this capability to allow you to custom design the appearance of tables in your AppliCad output.
If you do nothing, the tables will be presented using the default settings AppliCad has defined, however you are not constrained by these settings. You can create a text file that presets the appearance of the table in your Word document. This file is called tableformats.csv and may be edited to better suit your specific needs.
Since it is a CSV file (comma separated values format file), it may be edited in Wordpad, or preferably Microsoft Excel because the cells are fomatted for easy use.
It is in the form as shown below:
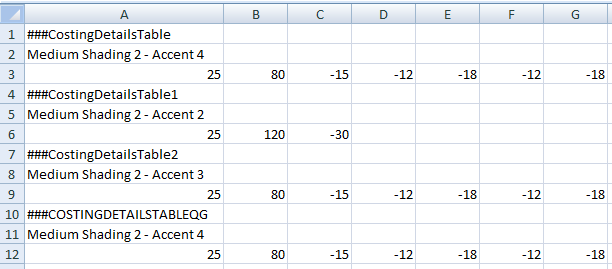
Required Table Layout
The first line is the name of the table. The second line is the name of the Microsoft Word pre-defined table appearance and format found in Microsoft Word under Table Tools > Design. Refer to Microsoft Word Help for more details on how to select these options. The third line describing each table format defines the width of each column in the table in millimetres. A positive width number sets the contents of the column to left justified; a negative width indicates that the content of the cell in the column must be right justified as you would wish to see currency displayed.
To enable the contents of a cell to be centre justified in the cell, add a 5 to the number – for example, a cell width of 18 indicates a cell will be 18mm and left justified, 518 will make the cell 18mm wide and CENTRE justified.
In the example below, the costing details table is displayed using the Word format called Medium Shading 2 – Accent 4. The columns are the widths as shown above (line 3 of our spreadsheet) and the numbers in the columns are right justified.

The roof drawing is also completed at this time with annotation that shows the adjusted scale of the roof picture.
To find out what a particular table format is called in MS Word so that you can add it to your to your table format definitions, open MS Word, insert a table. The Table Tools options come up:

Allow your mouse to hover over the required table style that you wish to use, and the name of that style and format is displayed. This is the description to type into the TableFormats.csv file.

TableFormats.csv would look like this…

User Defined Report/Drawing Names
The process of printing reports is tied to the templates available to the user and since these may be user defined, a great deal of flexibility has been designed into the Roof Wizard system. However, there are limits to what can be changed to ensure that all the automatic functions can work as they have been designed to do. Please proceed with some caution and note specific rules that apply so that the reports work as expected.
All the standard reports and drawings may be modified to suit the layout and design requirements of your business. This includes adding new reports using an existing template structure or to simply changing the name of a report or drawing as it appears in the list of operator options. However, the original list of reports is fixed and should not be changed or some automatic functionality will be lost. Starting with the standard list, you can design all manner of report templates to suit the way your business works.
This is achieved by creating a translation or lookup file that defines the structure of the report/drawing and its associated file name. There are two files – UserReportNames.csv for the list of estimates, quotations and lists and UserDrawingNames.csv with roof plans and panel layouts etc. Being a CSV file format, they may be edited in Microsoft Excel or Notepad. The form of this file is as shown below:
UserDrawingNames.csv
| Display Report | Actual Document Name | Drawing Type |
| ;Drawing Type 0-Roof, 1-Batten, 2-Block, 3-Offcut, 4-Sheet Layout, 5-Sheet Sequence, ;6-Sheet Cutting, 7-Flashing, 8-Flashing Profile, 9-Singley-Ply, 10-Wall Plan ;11-Wall Elevation, 12-Offcut Colour, 13-3D, 14-Cranking, 15-Scaled Ruler, 16-Individual Panel Layout, ;17-Block Cutting Layout, 18-Aerial Imagery Report |
||
| Roof | Drawing-Roof | 0 |
| Batten | Drawing-Batten | 1 |
| Block Layout | Drawing-Block | 2 |
| Offcut Layout | Drawing-Offcut | 3 |
| Panel Layout | Drawing-Sheet | 4 |
| Panel Sequence | Drawing-Sheet-Sequence | 5 |
| Panel Cutting Details | Drawing-Sheet-Cutting | 6 |
| Flashing Drawing | Drawing-Flashing | 7 |
| Flashing Profiles | Drawing-Flashing-Profile | 8 |
| Single-Ply Layout | Drawing-SinglePly | 9 |
| Wall Plan | Drawing-Wall-Plan | 10 |
| Wall Elevation | Drawing-Wall-Elevation | 11 |
| Offcut Layout (Colour | Drawing-Offcut-Colour | 12 |
| 3D Drawing | Drawing-3D | 13 |
| Arc Roof Drawing | Cranking-Drawing | 14 |
| Scaled Ruler | Scaled-Ruler | 15 |
| Individual Panel Layout | Drawing-Panel-Layout | 16 |
| Block Cutting Layout | Drawing-Block-Cut | 17 |
| Aerial Measurement Report | Drawing-Aerial-Report | 18 |
| Roof Sketch Pad [L] | Sketch-Pad-Letter | 0 |
| Roof Sketch Pad [A4] | Sketch-Pad-A4 | 0 |
In the case of the Drawing Reports, the form of these is more strictly controlled and the output style is determined by the information that is inserted on the form automatically by the software. For this reason, the drawing type must also be specified so that the required details for that drawing style are added.
Regular reports and drawing reports may be given any name that suits you, simply by editing the csv file. For example, a generic template called UserForm1 can be renamed in the table as Special Form 1 and that is the name that will appear in the list for selection for processing.
UserReportNames.csv
| ;Display Report | Actual Document Name |
| Quotation Letter | QuotationLetter |
| Quotation Form | QuotationForm |
| Quotation Acceptance | QuotationAcceptance |
| Quotation Details | QuotationDetails |
| Installer Pay Summary | PaySummary |
| Installer Pay Summary – QG | PaySummary-QG |
| Material Cutting List | MaterialCuttingList |
| Special Form | UserForm1 |
| User Form 2 | UserForm2 |
| User Form 3 | UserForm3 |
| User Form 4 | UserForm4 |
| Order Forms | OrderForm |
| Tax Invoice 1 | TaxInvoice1 |
| Tax Invoice 2 | TaxInvoice2 |
| Bill of Quantities | BillOfQuantities |
| Roof Quantities | Roof-Quantities |
| ;Do not add reports above this line and do not change the above order |
Renaming a standard form is simply a matter of changing the name in the UserReportName file.
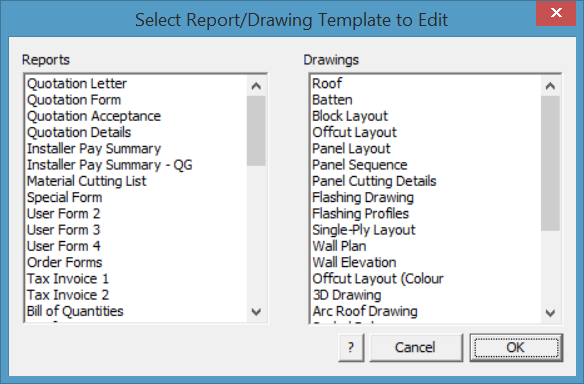
In each situation the report or drawing template must exist either as a sub-figure in the database RoofWiz.dab (as shown in the example list above) or as a Word template or Excel document of the same name. When the reporting process is run, the software looks for the Word DOC or DOT first (for example QuotationForm.doc) and if it finds a doc or template file, it runs it. If no Word DOC or DOT file is found, then it looks for an Excel XLS or XLT (for example QuotationForm.xls) and finally it searches for the standard CAD form that is the sub-figure in Roofwiz.dab (for example QuotationForm).
![]()
NB – There is one exception to this rule – the MS Word template of the OrderForm must be called ‘OrderFormTemplate.doc’ instead of ‘OrderForm.doc’ for the automatic substitution to take place. The file name reference will still refer to ‘OrderForm’ as shown above. Also note that this takes the place of OrderForm in the list in UserReportNames.csv and must be in the place in the list (that is, position 9 in the list).
Also note, DO NOT add reports above the last line of standard report options and do not change the order. If you wish to design a new report and add it to your list of options, add it below the line. Failure to observe this may result in reports not working correctly.
The process is entirely automatic, provided all the links in the process are there. Work carefully with this and get it right. Do it once and then it will save you hours and hours, over and over as you generate the multitude of report options that you might need to help run your business.
Once defined, the operator selects the command Reporting > Print Drawings and the available drawing options are displayed:
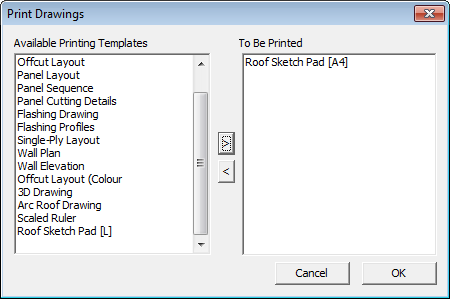
Double click the required drawing to be printed and it is added to the list. Select [OK] and the printing process will begin.
The job reports are generated after the operator selects either Reports > SupplyOnly or Reports > Supply+Install. Once the material list and labour summary have been checked, select the Print button.
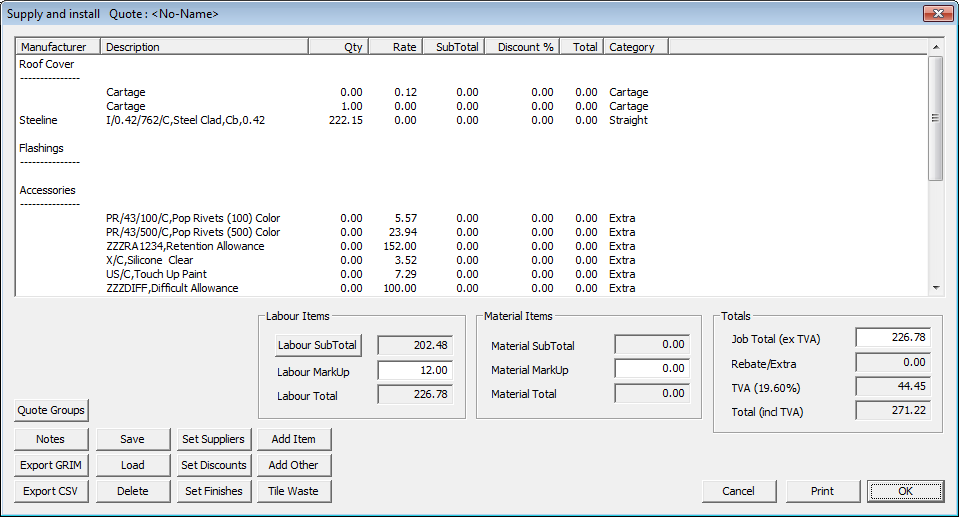
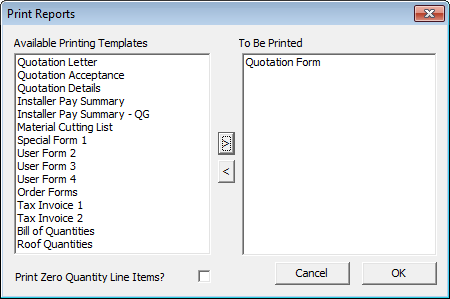
The list of available reports is displayed. Double click the required report and the select [OK] to process the data, generate and print the report.
The combined capability of report and drawing design using AppliCad, Word and Excel allows for extraordinary flexibility in designing custom reports and drawings for all aspects of your business from supplier orders to client proposals.
The page name for each report is placed on the report using the key text ###Title. The software looks for the report temple name, for the report being printed and replaces the key text ###Title with that name eg for Quotation Acceptance report, Quotation Acceptance will go into the report where you inserted ###Title. As has been explained above, these names are stored in the editable text files called UserDrawingNames.csv and UserReportNames.csv.
When creating your own custom reports, perhaps start with one of our standard forms and modify to suit. Make small changes to start with so that you see how the process works. Once you have confidence in what is required and the result that you get, then go hard. Make the reports/forms work for you.
Computing Values Using Line Items
Line items are values generated by the software and displayed in the Reporting > Supply Only or Supply and Install dialog box.
Using Line Items is a standard function of the software and is typically used to extract values for your reports based on calculated values using the Line Items where the value will vary with each job and quotation calculation.
For Line Item calculations to be determined in a report by the software (for Word or Excel based report templates only), the key text string for that Line Item must be preceded by two ## signs. This is a variation on the use of the # signs for the AppliCad based reports where three # signs are used. This is to ensure that the right calculation is being used in the right report.
##LI string search not only looks for the whole category, but also searches for a substring within the category also.
These text strings mimic the values in the costing dialog box. More exactly, they mimic the LineItem records in the grim file. This kind of text string is in the form:
##LI _<LineItemCategory>_<subcategory>_<LineNumber>
where <LineitemCategory> is the category you see in the costing dialog
and <subcategory> is one of SUP, CODE, PRO, FIN, QTY, RATE, TOT, DISC, SUB, COL
where SUP = Supplier; CODE = Product Code; PRO = Profile; FIN = Finish; QTY = Quantity; RATE = Cost; TOT = Total; DISC = Discount; SUB = Sub -Total; COL = Colour.
and <LineNumber> finds the instance of that category in the event that you have multiple line items of the same category.
For example, the Key Text String (KTS) ##LI_Roof Tiles_Qty_1 represents the code of the roof tiles category will insert that line item’s details into the required report.
So the key text string in the template would look like this – ##LI_Roof tiles_Qty_1
##<LI>(for line item)space<Category>(of Material)_(underscore)<Qty>(for quantity of material)_(underscore)<LineNumber>
For example –
##LI_Fascia_Qty_1
##LI_Fascia_Qty_2
##LI_Fascia_Qty_3
if you have three different fascia types on the same job as standard.
The structure is:
##LI_<Category>_<Sub-Category>_<Line-Number> where the use of the underscore between each element in the key text string is essential.
| Category | Sub-Category | Line-No |
| COVER (roof cover material)
FLASHFITT (flashing or fittings) ACCESS (accessories) FAST (fasteners) SEARCH (anything) |
MAN (supplier)SUP (supplier)
DESC (description) QTY (quantity) RATE (cost rate per item) SUB (sub-total cost) DISC (discount) TOT (total cost) CODE (product code) FULL DESC (product description) FIN (finish) GAUGE (base metal thickness) |
The line number required from the list displayed in the ‘Costing’ screen. |
The syntax for the use of the ##LI_SEARCH function is typically as shown below, used in this example to find an additional freight charge in the list of line items:
Additional Freight Charge $##LI_SEARCH(FRGHT)_Sub_1
This KTS searched for the category FRGHT anywhere in the list of items under Costing and returns the Sub-Total of the first ‘FRGHT’ item in your list. The text ‘Additional Freight Charge’ and the ‘$’ sign complete the entry in the report. The search term can be the whole or unique part of the category text.
Further examples of the use of these strings in your template might be:
| Cover – Product Code | Description | Quantity |
| ##LI_Cover_Code_1 ##LI_Cover_Code_2 ##LI_Cover_Code_3Etc. |
##LI_Cover_Desc_1 ##LI_Cover_Desc_2 ##LI_Cover_Desc_3Etc. |
##LI_Cover_Qty_1 ##LI_Cover_Qty_2 ##LI_Cover_Qty_3Etc. |
| Flashing – Product Code | Description | Quantity |
| ##LI_Flashing_Code_1 ##LI_Flashing_Code_2Etc. |
##LI_Flashing_Desc_1 ##LI_Flashing_Desc_2Etc. |
##LI_Flashing_Qty_1 ##LI_Flashing_Qty_2Etc. |
Where the cover material product code, the description and the quantity for three different cover materials on the job cost summary are shown in your report, followed by two types of flashing.
This may take a little set up and testing to get right, but worth the effort as it streamlines so much of the ‘hack’ work of generating quotations and job reports. Make sure that every entry is tested thoroughly once completed.
Inline Calculations with Key Text Strings for Word/Excel Reports
You can embed key text string values into a text string as a calculation.
The format of a calculation string is
%CALC [<expression>]:<precision>
where
%CALC is a key word stating that a calculation exists
[..] the brackets which encompass the expression and precision
<expression> the expression eg 2*###TotalIncTax +100
: a colon separating the expression and the precision
<precision> the number of decimal places you want to display
For example, to add 10% to the total price for a job,
The total price for you is %CALC [###totalinctax + ###totalinctax / 10]:2
If the ###totalinctax amount was 3000, then the amount reported above would be 3300.
![]()
Note: These calculations are also valid if they are included in a Grim Template File too.
Report Templates – CAD
Objective: To design or customize the report templates to suit your individual needs.
![]()
Note: This section may appear to be quite a daunting process at first as it requires use of many of the standard 3D CAD functions rarely used when modelling roofs and generating estimates. We suggest you are very familiar with the workings of the software before returning back to this point.
There are two distinctly separate processes for creating report templates from AppliCad software. This help document describes both – first the CAD template (what we have used for 25 years and still support), and the seamless integration with MS Word or MS Excel for report generation.
When output reports are created by the software, it first looks for a Microsoft Word template of the required name form, for example QuotationLetter. The file it is looking for must be saved in the ..\User folder or ..\Corporate and must have the name of QuotationLetter.DOC without spaces (as in Word Document) or QuotationLetter.DOT as a regular Word Template document.
If the software finds the DOC or DOT by the defined name, it will use it. If it does not find a Microsoft Word template, it will use the AppliCad default CAD template for QuotationLetter which is saved in the AppliCad database file, RoofWiz.dab in the …\User folder. This will ensure that all your existing default CAD templates will work as they do now when the software is updated by new releases.
Creating a template in MS Word allows for more creativity in design and many operators may be more familiar with Microsoft Word than the CAD functions. The use of Word Templates is described here. Using a Word template, you can have as much or as little information as you require for your projects. If you plan to use Word templates exclusively, you might consider going directly to that section, however, a lot of useful information is described below about the process.
AppliCad CAD Report Templates
The following pages describe editing the default CAD templates stored as a subfigure in the database file Roofwiz.dab in the …\User folder.
This section is only necessary if you find that the existing reports are not sufficient for your needs, that is, if you need to add further information to a report or change the layout of a report.
AppliCad default templates are stored in a CAD database called Roofwiz.dab according to the table below. If you decide to use Word to generate your reports and output tables, each template is saved as a Word template with the same name – that is, QuotationDetails as a sub-figure in RoofWiz.dab would be QuotationDetails.DOT with Microsoft Word.
The first step when modifying your AppliCad generated report templates is to find them. The CAD Report templates can all be found by going to Tools > More…> Edit Templates. You will be presented with a box as shown below.
You will need to save the last roof job you were working on before modifying the templates as your job will be cleared to open the template ready for editing. If the job has not been saved, you will be prompted to do so.
By selecting the form you wish to modify, that template will be opened in the main screen, similar to the picture on the following page.
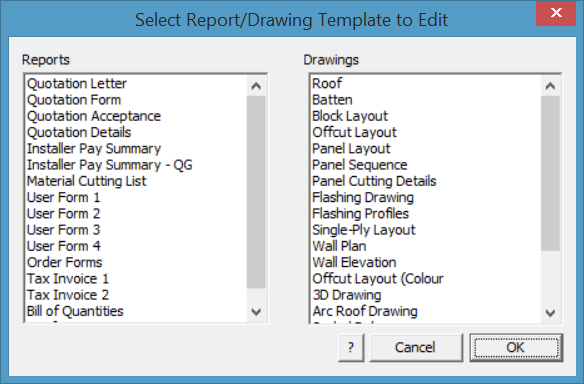
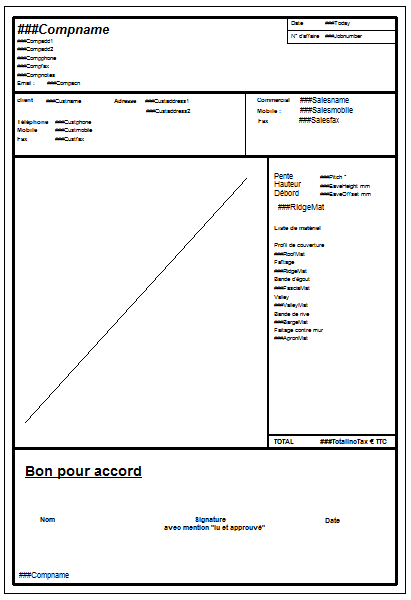
From here you can modify the template – adding line work using the CAD functions, or adding Key Text Strings [KTS] for software generated values or regular text for annotation of the report. This process is described in substantial detail below. You may also find more detail [KeyText Strings] where all the available key text strings are listed.
Template Structure
The output reports in the AppliCad software are automatically generated from the user defined templates listed above. When you click the Print button on the Reporting > Supply and Reporting > Supply and Install dialog boxes, the following list of standard reports are available to be printed.
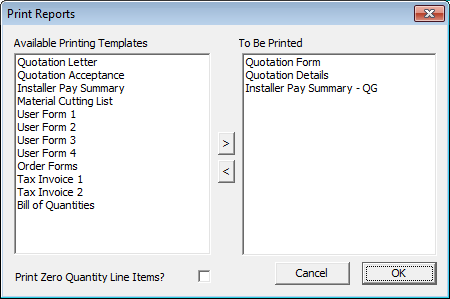
The following table describes each of the CAD reports on the Select reports to print dialog box as well as which template is used:
| Report name | Template name | Intended Use |
| Quotation letter | QuotationLetter | A quotation to send to your customer detailing the information as a letter |
| Quotation form | QuotationForm | A quotation to send to your customer detailing the information in a tabular fashion. |
| Quotation acceptance | QuotationAcceptance | Same as above with the addition of a place for the customer to accept the quote with a signature |
| Quotation details | QuotationDetails | This report tabulates the materials and costs for the job |
| Installer pay summary | PaySummary | This report tabulates the labor costs for you to perhaps give to the installer |
| Material cutting list | MaterialCuttingList | This report tabulates the sheet and flashing cutting lists |
| User form 1 | UserForm1 | An extra form for you to define |
| User form 2 | UserForm2 | An extra form for you to define |
| User form 3 | UserForm3 | An extra form for you to define |
| User form 4 | UserForm4 | An extra form for you to define |
| Order Forms | OrderForm | The Supplier’s Order form. Generated for each supplier in your list of required items. |
| Tax invoice 1 | TaxInvoice1 | A tax invoice |
| Tax invoice 2 | TaxInvoice2 | A tax invoice |
| Bill Of Quantities | BillOfQuantities | A Bill Of Quantities report |
| Roof Quantities | Roof Quantities | Summary of roof geometry (areas and lengths) and a roof plan |
![]() Note – The order of these standard reports is set – do not change the order.
Note – The order of these standard reports is set – do not change the order.
Also do not add new report names above this standard list. If you add new template options, add them below the standard report templates.
Standard Notes on standard CAD Report – Tax Invoice 1 or Tax Invoice 2 –
If you print standard CAD Report Types 12 or 13 (Tax Invoice 1 or Tax Invoice 2), the software stops to ask you what you want it to say on the Invoice report and this is the dialog that is displayed. The text strings come from the file TaxInvoiceNotes.txt and can be modified in Wordpad or Notepad to say whatever you want them to say on your invoice template(s).
The following dialog box is displayed when you select either of the Tax Invoice reports:

Linking Templates to Output
You can however create any other report template with any name so long as these names are listed in the text files called UserReportNames.csv and UserDrawingNames.csv . The software needs to know that you have created a new template, what it’s called, and how you wish to refer to it.
UserReportNames.csv is where the preset template names for CAD and Word/Excel Report Templates are associated with the reporting output process.. This allows any template form/report to have any name when displayed in the print options list. Column A is the name you wish to have in the [Print] options list. Column B is the actual file name in the ..\User folder when viewed in Excel.

Do not add new templates or change the order of this list. If you add new template options, add them below the standard report templates.
UserDrawingNames.csv is where the preset template names for both CAD and Word/Excel Drawing Templates are associated with the drawing output process. This allows any template form to have any name when displayed in the print options list. Column A is the name you wish to have in the Print options list. Column B is the actual file name in the ..\User folder. For drawing output as distinct from report output, you need to tell the software what sort of drawing it is so that th ecorrect information is automatically included, without you having to do any further work in generating the report. This is done in column C using the code number as required.

Once a new template has been created, and saved to the …\User folder, it can be added by simply going to the Tools > More > Edit User Templates option.
The complete list of both CAD templates and Word/Excel templates is displayed.

To add your new Word template to the list, select Add/Edit and the Edit Report dialog is displayed that provides for you to add the new report name (as you want it to appear in your print options list) and then select the name of the actual template file (for Word or Excel) or subfigure name (if it is a CAD template).

Select [OK] and the new report template is linked and available in your print list. If it is a drawing template, the extra option is displayed to set what type of drawing output you require.

Creating and Modifying Templates
When you look at one of the templates, you will notice that it comprises line work, text labels, text strings with a prefix of ### and possibly a diagonal line. To select a report template to edit, go to Tools > More… > Edit User Templates and select the report from the list displayed
Modifying the Template Text
Insert Key Text Strings
Once we have decided what our template is to look like, we start adding or modifying text on our template. It is recommended that the best way to develop your skills with creating templates is to try to replicate the reporting process that you currently use. This has shown to be a great way to get going with a process that can be complex at times.
There is what we call regular or normal text and key text strings. Key text strings (KTS) are actually commands interpreted by the software that are ‘embeded’ into the template. The software identifies the subject of the key text, finds the detail in the job and places that detail into the template in the place of the key text.
Selecting the appropriate key text is made easy by the key text string selection dialog box.
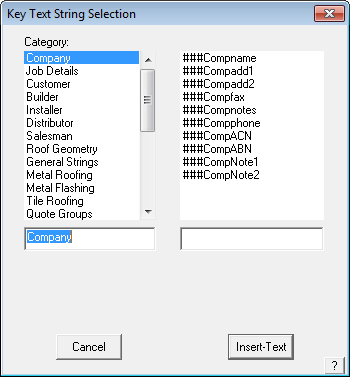
Go to the function Tools > More… > Modify Text > Insert Key Text from the Pulldown menu and the Key Text String (KTS) dialog is displayed.
From the KTS selection dialog box you can insert a text field that is linked to the appropriate information in the model database. Therefore if you put in the ###Compname field, when you print up your reports, the Key Text String (KTS) will be replaced by the company name for the quote. To show the fields on the left of this dialog box, click on the down arrow at the end of the field.
From here you can select category, and the KTS from that category will appear on the right hand side of the dialog box. To insert the KTS, click on the KTS that you want to insert and then click on Insert-text. You will then be asked where you want the text to be placed. Move the pointer to where you want the text to go and left click the mouse. The KTS will now appear on your screen.
A list of all of the Key Text String’s is found in the back of this manual. A KTS exists for every variable and data table that you are likely to need. There are dozens of Key Text Strings covering every conceivable bit of information to do wth roofing and estimating.
It is recommended that the best way to develop your skills with creating templates is to try to replicate the reporting process that you currently use. This has shown to be a great way to get going with a process that can be complex at times.
Select the text string that you need and place it on the template. The text style, size and position is determined by the style etc of the Key Text String so this needs to be checked too.
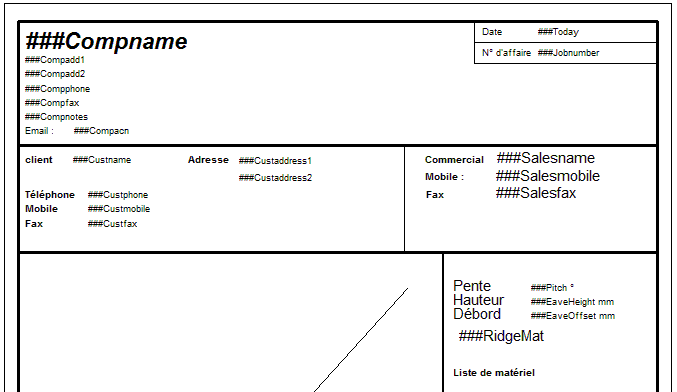
Regular or normal text – no ### signs Key Text String – with ### signs
The key to preparing a good report and submittal drawing is to know exactly what information you want to show on the report, and where you want it to go, before you start editing. Key text strings can be also recognized even if they are embedded in another text string. For example, you may enter the following as a text entity:
Dear ###CustName,
The price for your job is $###JobTotal. Thank you for the opportunity to quote your job, etc.
This overcomes the problem of having to space the regular text label that you want and the key text string variable.
Insert Normal Text
The next item on our Tools menu is Ins-Text. Click this command and the following dialog box will appear.

From this dialog box you can insert your own normal text that annotates the report. Type in the text that you want to put on the template and then click [OK]. You will then be asked where you want to put your text. Move the cursor to where you want your text to go and left click the mouse. Press the right mouse button to exit the placement stage, and you will be brought back the previous dialog box. If you would like to add in more text simply repeat the process previously explained. If you would like to exit simply click on [Cancel].
The next item on our Tools menu is Text-Defaults. Clicking on this command will bring up the following dialog box.
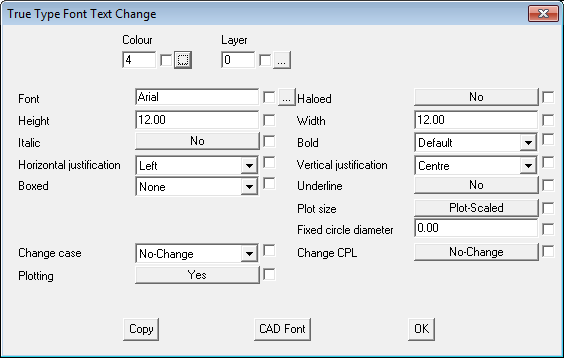
In this dialog box we have a number of choices setting the presentation of the text. Bear in mind that any changes that are made in this dialog box will stay as the default for any new text that you may put in. For this tutorial we are only going to go through the basic functions of this dialog box, these are Colour, Font, Height, Italic, Boxed, Horizontal Justification, Bold and Underline.
The first of these commands that we will use is the colour function. Click on the selection box after the colour field, and a colour palette will appear, select the colour that you want and then click [OK].
The next field we will change is that Font field. To change this, click on the selection box at the end of the font field. This will bring up the following dialog box.
From here select the font that you want and click [OK].
We will ignore the x Offset field, and move on to the height field. This field is where we set the height of the text, the larger the number the larger the size of the text. To change this field, click on it and type in the size that you want.
The next field we come across is Italic. Changing this to yes will put the text in Italic. To change this click on the box to change it from Yes or No.
The next field we come across is the Horizontal Justification field. This command is used to describe where the text will be written from, for example, the text will write normally. The text will write from left to right across the screen. Or, stay centered on a particular point. To edit this field click on the arrow at the end of the field. This will open up a drop down menu with 3 choices in it Left, Center and Right. Move the highlight down to the choice that you want and click on it. The menu will close and the choice you made will be left in the field.
The next field is Boxed. This field uses a drop down menu, in which you can put a border around the text if you want to. If you do not want to put a border around the text leave this on None.
We will skip the next three fields which are Haloed, Y Offset and Width, and move onto Bold. This field also uses a drop down menu setup, in which you can alter the boldness of the text if you want to.
Underline, is the next field we come across. Selecting Yes in this field will put an underline on the text. If you don’t want this, leave this on No. The remaining fields we will ignore for the time being. (You may wish to read further about this in the online CAD manual mod44.pdf).
To save these fields as your default click on [OK], and the settings will be saved.
The next command that we come across is Change. Clicking on this will bring up a dialog box similar to that of the Text-Defaults dialog box. The main difference with this command is that it will only change the text for the text that you select. Make the changes in the appropriate fields and then click [OK]. You will then be asked which text you would like to change. Select the text and right click the mouse. The following dialog box will then appear
If you have chosen the correct text then click on Yes. If you have not then click on No, and reselect the correct text.
The next command that we come across is Move. Click on this command, and you will be asked to select which text you would like to move. Select your text, and move the cursor to where you want the text to be moved, you can snap to a point. When your text has been moved to the correct location right click the mouse. If you don’t want to move any more text right click the mouse again.
The next command that we come across is Copy. Click on this command, and you will be asked to select which text you would like to copy. Select your text, and move the cursor to where you want the text to be copied to. When you have finished copying your text, right click the mouse. If you don’t want to copy any more text right click the mouse again.
The Next command that we come across is Edit. Click on this field and you will be asked to select which the text that you want to edit. When the text has been selected type in what you would like the text to be, and click [OK]. This will change the text to what you have written. If you have chosen the wrong text, or want to exit click on [Cancel].
The final command is Delete. Use this command to delete any unwanted text. Simply select Delete and you will be asked to select what text you would like to delete. Select the appropriate text(s), and then right click the mouse. The following dialog box will appear:
If you have selected the correct text then click Yes, and the text will be deleted. If you have chosen the wrong text click No.
That completes the section on how to edit the text on your templates.
Modifying the Layout
You might want to edit the layout of the template, change the line borders or text boxes or to have the roof plan inserted onto a template. To add the roof plan you must draw a diagonal line that sets the extents of the roof plan picture on either layer 999 or layer 990. Layer 999 draws the roof plan; layer 990 draws a flashing drawing.
To modify the line work, select CAD from the main menu followed by Line. This will bring up the following menu.
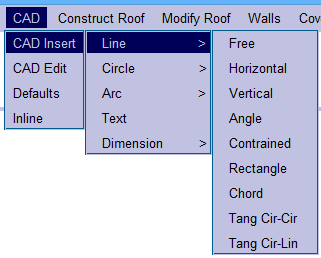
From this menu we will only need to use 6 commands. These commands are Insert, Edit, Move and Delete. The first of these commands that we will use is Insert. This command will bring up the following menu.
From this menu we will yet again only use a few commands. These commands are typically Free, Hor, Ver, and Constrain. By selecting Free you can draw in a line using the cursor anywhere on the screen, with no set length or angle. When you have drawn your line right click the mouse to exit this command.
The next command is Hor. This command will allow you to draw a horizontal line anywhere on the screen, with no set length. To draw in you line move your cursor to where you want your line to start and left click the mouse. Then move your cursor to where you want your line to end, the angle of the line doesn’t need to be perfect as the program will draw a perfect horizontal line. As before, right click the mouse to exit this command.
The next command is Ver. This command works exactly the same as the Hor command but will insert a vertical line instead. The next command is Constrain. This command will allow you to draw in lines of any length, but you can set a constraint on the angles,(i.e. 45).
The next menu option that we come across in the CAD Edit > Trim. Selecting this option will bring up the following menu.
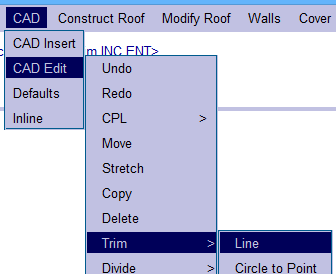
From this menu we will only be using the one command, which is Line. This command will now allow you to trim a selected line to a point intersecting another line. In other words you can trim two lines to make a perfect corner. To do this first select the line that you would like to trim, making sure that you select closer to the end that you would like to be trimmed otherwise the line will be trimmed from the wrong end causing generally an extremely short line. When you have selected the line, select the line that you would like the first line to be trimmed to, and your line will then be trimmed to the second line.
To exit this command simply right click the mouse.
The next menu option that we come across in the CAD Edit > Move. Using this command you can move an entire line to anywhere on the screen. After selecting this command you will be asked to select the line that you would like to move.
Select the line that you would like to move, taking note of where on the line you selected as it will take the end closest to where you selected as the reference point as to where you place the line. When the line has been selected, move the cursor to where you want the line to start and left click the mouse. You can continue moving this line if you wish by continually pressing the left mouse button. If you are happy as to where the line is you cancel the placing of the line by right clicking the mouse. If you don’t want to move any m ore line you have to right click the mouse again, because the software will be asking you to select the next line that you would like to move.
The next menu option that we come across in the CAD Edit > Delete. This command is used for deleting line(s). Simply select this command and you will be asked which line(s) you would like to delete. Select the line(s) that you would like to delete, and right click the mouse. This will bring up a similar dialog box to the following:
If the selected lines are correct, select Yes, and you line(s) will be deleted. If they are not, select No. and reselect the correct lines. The next menu option that we come across is the CAD Edit > Change. This will bring up the following dialog box.
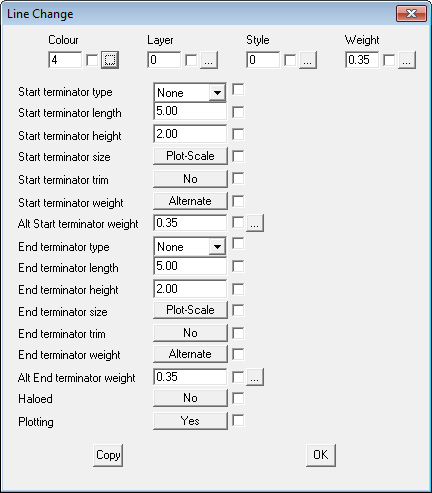
From this dialog box you can change the style, colour and thickness of a line. To change the colour of the line click on the selection box at the end of the colour field.
This will bring up the following dialog box.
From this dialog box you can select the colour of the line that you want. To do this simply select the cour that you want from the pallete, or type in the corresponding number. When you have chosen the correct colour click on [OK], and you will return to the main dialog box.
The next command we will use from the main dialog box is Style. This will change the style of the line. Click on the selection box at the end of the Style field and the following dialog box will appear.
From here you can see all the types of line that you can use. To choose a line simply click on the number next to the appropriate line or type in the number. When the correct line has been chosen, click on [OK], to return back to the main dialog box.
The final command that we will use on the main dialog box is Weight. The command is used to change the width of the line. Clicking on the Weight selection box, will bring up the following dialog box.
To change the thickness of a line, click on the number corresponding to the appropriate thickness, or type in the number. When the appropriate thickness has been chosen click on [OK], and you will be returned to the main dialog box. Now that all of your specifications have been entered, click on [OK] and you will be asked to select the line(s) that you would like to change to the specifications that you have just set. One the appropriate line(s) have been selected, right click the mouse and the following dialog box will appear.
If the line(s) that you have selected are correct click on [OK], and the line will be changed. If the lines are not the lines you wish to change, click on No, and reselect the line(s) that you would like to change.
The final command that we will look at in the CAD Edit > Defaults. Clicking on this will bring up the following dialog box.
This dialog box is identical to the one under Change, but the only difference is that any changes you make in this dialog box will be saved as your defaults. Meaning that every time that you open the Change dialog box whatever the figures that you entered into this box will be the figures that will be in the Change dialog box.
Ins-Logo This command allows you to insert your company logo onto your template. The logo must be saved into your USER directory and be an image file. The best formats are, JPG, BMP and TIF.
Text-Defaults This command lets you set the defaults for text insertion.
Change-Text This command lets you change the appearance of an existing text entity.
Move-Text This command lets you move a text entity from one location to another.
Copy-Text This command lets you copy a text entity from one location to another.
Edit-Text This command lets you edit an existing text entity.
Delete This command lets you delete an existing text entity from the model.
Set-Text-Height This command lets you set the text height for tables which appear on 5 separate reports.
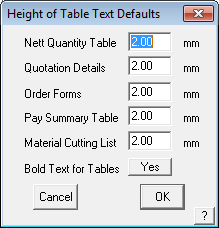
Set Text Field Width This option allows you to define the text width for notes text and other width definable text on reports. This edits the template for the report.
Make-Text-Float This command allows you to make text “Float” so it is not moved by other Key Text Strings. Mainly used when setting up Quote Group templates.
Tools > More… > Modify Text > Insert Co Logo allows you to add a graphic format image onto the template. Usual formats include BMP, JPG, PNG. The file should be copied to your ..\User folder so that is available to select without navigating away from the ..\User folder. It is helpful if the image is already at the required size and scale to suit the template layout. You can only use one graphic in each of your CAD templates (which is different to MS Word templates where you can have as many as you need). If you need a more complex graphic, consider combining them into one graphic in your graphics editor (such as Paint etc) then place the combined graphic into the CAD template. Indeed, the graphic might include an entire page with things like check boxes and Terms and Conditions which will form a back ground to the report and allow the report to work like a response form. The software doesn’t care what the graphic contains.
Select the required graphic from your ..\User folder and then select the top left corner of the graphic location and a ‘stretchable’ box allows you to set the extents of the graphic by selecting the lower right corner location on your report.
Once your new report is complete don’t forget to save it – File > Save if you’re updating an existing form or File > Save-As if it is a new one. The default location is the file RoofWiz.DAB.
Reporting Key Text Strings
The section describing Key Text Strings (KTS) has become so voluminous that it has justified its very own pages. Click here for a detailed description of each KTS.
Data File Formats and Data Structures
The section describing data file formats has become so voluminous that it has justified its very own pages. Click here for a detailed description of each KTS.
- Supply Only
- Supply and Install
- Report Templates – MS Word
- Report Templates – CAD
- Nett Only
- Multi GRIM Out
- Key Text Strings
- GRIM File Import/Export
- Fascia and Gutter
- Drawings
- Data File Formats and Data Structures


