Contents
- 1 Solar Planning and Design
- 1.1 Solar Planning and Design Tool Kit
- 1.2 Solar North Marker
- 1.3 Shadows
- 1.4 Generate Insolation Map
- 1.5 Insert Roof Grid
- 1.6 Add Exclusion Zones
- 1.7 Using the Insolation Map in Reports
- 1.8 Render
Solar Planning and Design
Solar Planning and Design Tool Kit

This group of functions is selected from the Roof Wizard main menu and provides the operator with tools that are particularly useful for planning a roof job (the roof grid); calculating shadows and solar radiation (for solar heating and photo voltaic installations) and applying texture maps to the roof model for visualisation of the roof installation. It does assume a high level of competence in the modelling skills required to create the roof and wall geometry, previously described in this manual.
The Process
The foundation of the SolarWizard software process is based upon the creation of accurate roof geometry in Roof Wizard – ie the roof geometry must first be correctly modelled in 3D space. The model may be created using dimensional data from an architect’s blueprint, a field sketch, a scanned plan or an aerial image.
It is from this model of the roof that the roof areas and quantities are extracted, plus a simulation and calculation of solar radiation and shadows from roof features and other objects based on orientation to true North. Clearly, if the roof modelling is not accurate, the whole process is compromised.
We have devised a simple four step process to ensure an easy, accurate outcome-
Define the roof geometry,
Check the roof geometry,
Select the location,
Select the locale radiation table,
Generate the shadows and solar radiation, and
Print client proposal.
It is a simple matter then of printing the necessary report using the template that you have defined. Standard report templates are provided so that you can make a start immediately. These may be edited at any time by you, to suit the needs of your business.
The usual starting point for a roof using this system is a basic hip and valley roof where the eave height is the same all the way around. From this just about any roof may be created by adding all the architectural features including dormers, atriums, gables, verandahs etc. (Specialised roof shapes such as a barrel vaulted roof, or simple flat or skillion roof are usually handled separately).
After the roof geometry has been created, the solar radiation and shadow map is generated. Other buildings, fixtures and fittings that impact on the shadows cast may be added.
Solar North Marker
![]() The north marker is used to indicate true north in relation to the roof model. This is then used to rotate the model relative to true north so that shadows and sun azimuth are calculated correctly. If the North Marker is not placed on the model, the software assumes that north is up the screen.
The north marker is used to indicate true north in relation to the roof model. This is then used to rotate the model relative to true north so that shadows and sun azimuth are calculated correctly. If the North Marker is not placed on the model, the software assumes that north is up the screen.
The operator may design their own north marker. A north marker is created as a sub-figure and saved in the system database called RoofWiz.dab. This is the same CAD database that stores the CAD report templates. The sub-figure must be called NorthMarker to be placed automatically.

Before rotation to North

After rotation to North (when calculating shadows and azimuth)

Shadow calculations used for town planning situations, in this case the effect of a new extension on the neighbour’s pool area.

Assess the effect of shadows on roof fittings.
 Shadows
This function allows the operator to create shadows for a range of days and/or times (or just one day and time) and save the results to different layers for later use. An animation of the series of shadows may be produced and saved as an AVI file in whatever format is available on your PC.
Validation of AppliCad’s Shadow Calculation Tool
The AppliCad Shadow and Aggregate-Shadow Tools use complex mathematics to determine the position of the sun and assumes rays from the sun are parallel for the purposes of determining shadow positions. Such assumptions are sufficient for the majority of cases and given all AppliCad functions utilise double-precision (8 byte) floating point accuracy within a millimetre-based modelling system, this accuracy is maintained across all of AppliCad’s tools.
Sun Positioning
The position of the sun is perhaps the single most important factor in determining the accuracy of shadow diagrams. AppliCad software uses a simple four-step process in calculating the sun position. These steps are:
- Specification of year, month, day, hour and minute, along with a time offset from UTC (Universal Time Coordinate Origin) to determine a Julian Date. Julian dates are used for scientific purposes by the astrological community to present time in days and fractions of a day since January 1, 4713BC, Greenwich Noon.
- Calculation of approximate angular solar coordinates using a simple mathematical algorithm based on the Julian Date. These coordinates are approximated to an accuracy of 1 arcminute within two centuries of 2000. Thus, this accuracy is sufficient for the year period 1800 – 2200.
- Calculation of a sidereal day from the Julian Date. This is used for the next step in the process and simply calculates the sidereal time, which is a method of timekeeping relative to the fixed stars as opposed to our local sun. Our calculation in this instance is accurate to 0.1 seconds, or approximately 1.5 arc seconds of the sky.
- The final part of our calculation utilises the approximate angular solar coordinates provided from step two, along with the sidereal day calculations from step three to determine the azimuth and altitude of the sun relative to a position on Earth. The position on Earth is provided in terms of latitude and longitude, passed in as double-precision floating point values and is returned as the same precision variables from the function.
Single Shadow Calculation
AppliCad’s single shadow method positions the sun in the sky at a height of 5 kilometres and then requests the user to locate the planes onto which to cast shadows. All shadow casting elements (planes, ruled surfaces, surfaces of revolution and sub-figures containing these elements) are then selected for processing. Each shadow-producing element is triangulated (based on circle and curve tolerance factors that can be set by the user within the software) using a Delaunay triangulation method.
Triangle shadows are calculated and clipped against the shadow planes selected with shadow triangles falling outside the shadow planes being disregarded. Triangles falling on an edge are clipped and merged with any other triangle planes already within the planar polygon.
The net result is a complex shadow polygon that is then tagged as a shadow polygon and placed onto a specific layer based on the time and date of the required shadow.
Aggregate Shadow Calculation
Shadows calculated across a range of times can be performed using the Gen-Insolation tool which provides a less accurate solution but generally much faster calculation times for very complex models. The Aggregate Shadow Calculation tool divides planes up into squares (or pixels) with the size being specified by the user. Again the sun position is calculated in the sky and placed at a height of 500 kilometres.
A line is drawn from the centroid of each pixel to the sun position and a simple calculation is determined to see if any planes cut this line and if they do, the pixel is considered to be in shadow and the whole pixel is greyed (in shadow) without any clipping being performed. If not, the pixel is left white and the calculation continues onto the next pixel.
Insolation Calculation Options
Selecting the option brings up the Shadow dialog box:
The first thing to do is plan your shadow sequence – do you want same time on a series of days in a month or the same day each month or a series of hours in a day at say the winter and summer solstice (the shortest and longest days).
Once this is decided, then set your sequence up to give the required results. Typically, you select your date first.
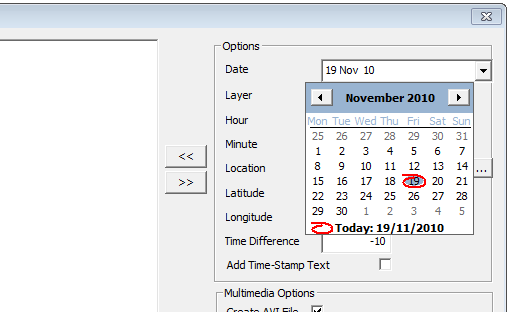
Selecting the date field drops down a calendar where you select the day you wish to prepare a shadow sequence for. The next step is to set the starting layer for the sequence of shadows. It is usual to have each sequence on a different layer so that each shadow sequence may be reviewed independent of other shadows.
If one is preparing a sequence for a particular day, say from sun rise to sunset during the shortest or longest day (June 21 and December 21 respectively), then the define the hourly increments against each layer starting at layer 100. As the hour is incremented, the layer is automatically incremented from 100. As each hour is defined, select the double left arrows [<<] button to add that time to the list of times that the shadows will be calculated for. If you wish to delete a time/layer group highlight that group and select the double right arrows button [>>].
If you believe that you will use this sequence on a regular basis, save the sequence for future use. This is particularly useful if your business is normally around a particular city or region.
The software needs your location. Select your location from the list (Latitude and Longitude and time difference are pre-defined) or define a new location. Define the latitude and longitude for that location and the difference from UTC – Coordinated Universal Time is closely related to Greenwich Mean Time (GMT). Note that daylight saving adjustments are not automatically made.
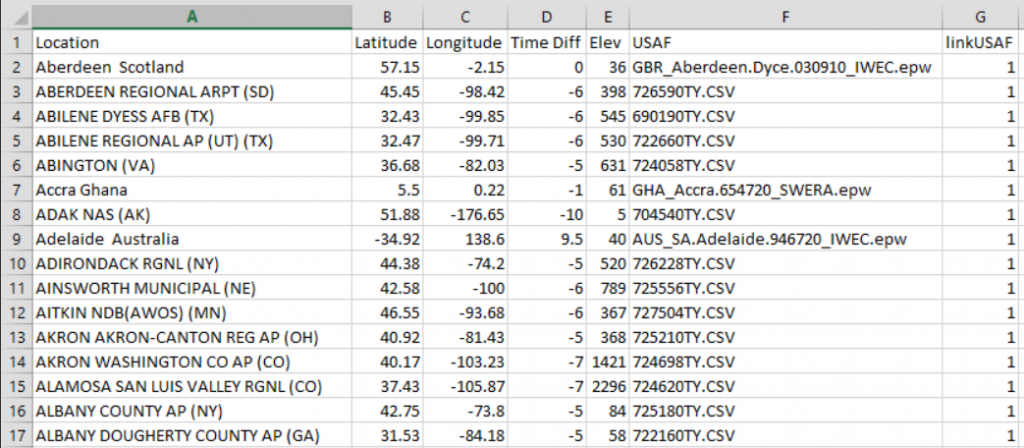
This information is stored in a text file located in the …\Roof Wizard\User folder called locations.csv and looks like this when opened in MS Excel…
If you wish to be prompted for the date and time text to be added to the sequence, indicate that by checking the ‘Time-Stamp’ box.
You may also select from a list of pre-defined cities. Select the […] button next to the Location field. You may add locations and edit details of locations. Note that longitude Eastings are positive values and Westings are negative values; latitude Northings are positive and Southings are negative.
Time east of Universal Time Coordinated (UTC) are positive and west of UTC are negative.
You can run the study to check the result on your model without creating an AVI file. Click the Run Study button and the software prompts you for the layers to cast shadows upon. Some preparation ahead of time, setting up the model is assumed at this point. It is assumed that you have added the roof fixtures (panels, AC Units, plumbing vents etc) and perhaps a site base and whatever trees and surrounding structures that are part of the study and that will impact on our study.
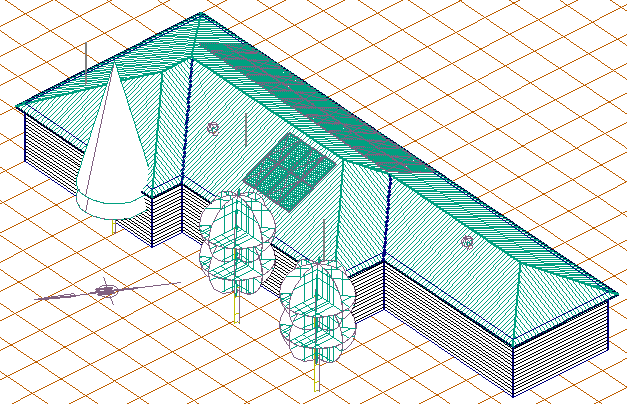
Also check that the whole model is oriented towards north. The top of the screen is considered to be north by the software, so you may have rotate the whole job to face north.
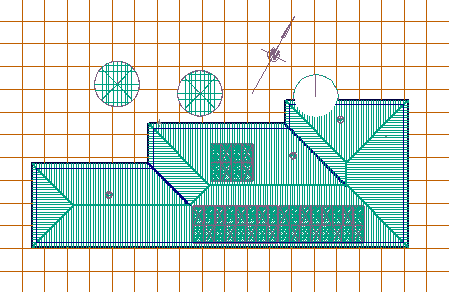
Before rotation to North.
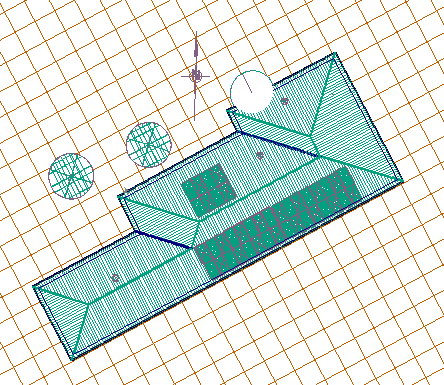
After rotation to North
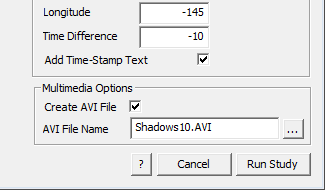
Now select [Run Study] and the software firstly creates the shadows on each defined layer in sequence and saves the information away, then it prompts for the Codec to use to write the AVI file and then writes an AVI file into the operator’s User folder.
The AVI file will vary in size substantially and this is determined by the complexity of the model, the number of sequences and the Codec used to create it.
![]() Note: the creation of the animated file uses Codec’s that are resident on your PC and not supplied by AppliCad. For a discussion about Codecs, the formats and how they work, refer to your PC manual or perhaps search Google for a detailed explanation. In short, a Codec is the embedded application that compresses the screen graphical data in a form that might be replayed in a media player such as Quicktime® or Windows Mediaplayer®. The size of the resultant AVI multimedia file is a function of the Codec used.
Note: the creation of the animated file uses Codec’s that are resident on your PC and not supplied by AppliCad. For a discussion about Codecs, the formats and how they work, refer to your PC manual or perhaps search Google for a detailed explanation. In short, a Codec is the embedded application that compresses the screen graphical data in a form that might be replayed in a media player such as Quicktime® or Windows Mediaplayer®. The size of the resultant AVI multimedia file is a function of the Codec used.
To review your animation, open up Windows Explorer, navigate to the User folder and find the file name that you specified. Windows will usually have made an association with different file type extensions and automatically select the correct program to open and play your animation.
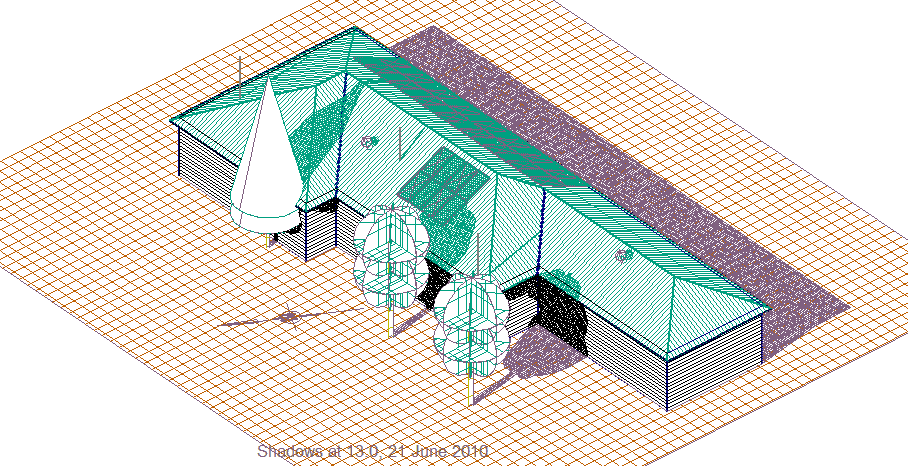
Date and time stamp
You may play this to your client or email it to them to review in their own time. Consider the size of the file before you automatically send it to your customer. He might not appreciate clogging up his email server with your huge animation files!
 Create Animation
If you do not create an animation while running the Sun Study, you can create it later by selecting the option – Solar > Create Animation. With this option you may create the animation after the Sun Study has been run and you also have an option to create a ‘fly through’ animation or a ‘spin’ animation for your client.
![]() Note: the creation of the animated file uses Codec’s that are resident on your PC and not supplied by AppliCad. For a discussion about Codecs, the formats and how they work, refer to your PC manual or perhaps search Google for a detailed explanation. In short, a Codec is the embedded application that compresses the screen graphical data in a form that might be replayed in a media player such as Quicktime® or Windows Mediaplayer®. The size of the resultant AVI multimedia file is a function of the Codec used.
Note: the creation of the animated file uses Codec’s that are resident on your PC and not supplied by AppliCad. For a discussion about Codecs, the formats and how they work, refer to your PC manual or perhaps search Google for a detailed explanation. In short, a Codec is the embedded application that compresses the screen graphical data in a form that might be replayed in a media player such as Quicktime® or Windows Mediaplayer®. The size of the resultant AVI multimedia file is a function of the Codec used.
Layer On/Off Animation
When this option is selected the following dialog box is displayed and you will select the option Layer on/off Animation.
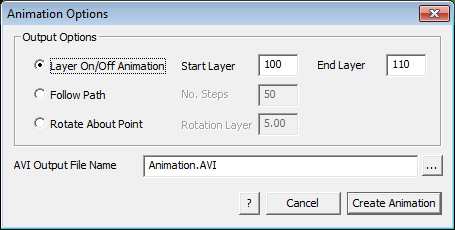
Set the start and finish layer you defined when creating the original shadow study (we have suggested that they start at layer 100 and through to how ever many layers you need for the sequence).
Next set the path and the file name for the animation file and click Create Animation. The screen will come to life making the file and the file saved. The AVI file will vary in size substantially and this is determined by the complexity of the model, the number of sequences and the Codec used to create it.
To review your animation, open up Windows Explorer, navigate to the User folder and find the file name that you specified. Windows will usually have made an association with different file type extensions and automatically select the correct program to open and play your animation.
Follow Path
This function is designed to provide a method of creating an animation that will show your client how their roof might look approaching it from the end of the street for example, along a ‘flight path’ that you define.
To use this option, first you must insert a curve in 3D space that defines the ‘flight path’ that transits your model, using the CAD > Curve Insert > Bezier function on the Icon menu. This is inserted onto the Construction Plane (CPL). Your model should now look similar to that below:
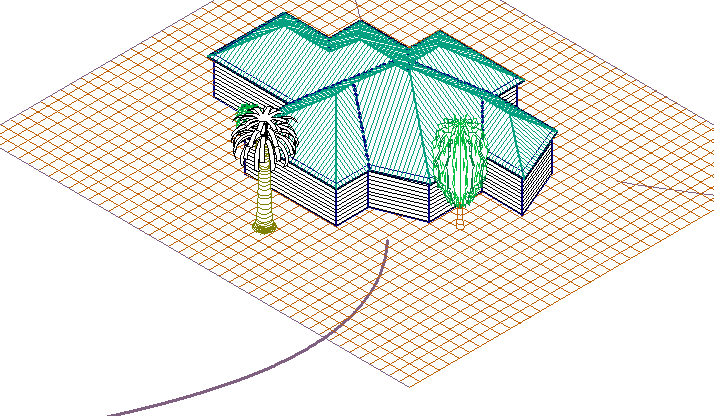
The inserted Bezier curve that is our ‘flight path’.

Now set you view to ISO View and select the Render > Create Animation > Follow Path option. Set the height of your eye and the file name to write the AVI file to and select Create.
You can add as much detail to your roof model as you like using all of the CAD functions. Just remember that the more you want to add, the more time you invest in your customer’s job.
There are more details at the end of this section for setting up and changing the animation.
Rotate About Point
This option allows you to create an AVI animation file by rotating about a point in the current view. It makes sense to do this in the ISO view, so change your view to ISO to begin with, then select the option Solar > Create Animation > Rotate About Point, define the AVI file name and the increments of degrees of rotation. Then select create and the AVI file is created.
You may play this to your client or email it to them to review in their own time. Consider the size of the file before you automatically send it to your customer. He might not appreciate clogging up his email server with your huge animation files!
 Show/Hide Layers
The operator selects the start layer (select a layer beyond those layers used by the software – anything above layer 100 will work) and as the shadows are created, and each shadow calculation in a sequence of shadows is saved to that layer and incremented for each shadow calculation. If you start at layer 100 and do ten steps during a day, then the first shadow calculation goes on layer 100 and the next step goes on layer 101 and the next step to layer 102 etc.
The example below has layer 100 on and the other layers in the sequence are turned off.
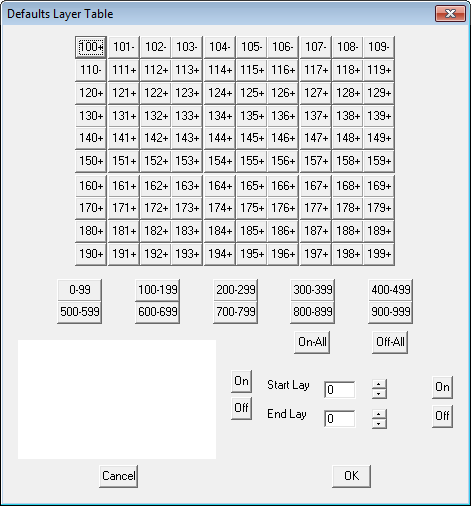
Show/Hide Entities
[Pulldown Menu only]
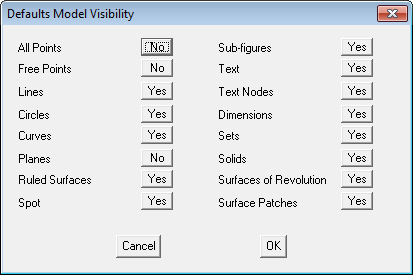
Allows the operator to select entities to be displayed along with the roof model and the shadows or insolation map.
 Generate Insolation Map
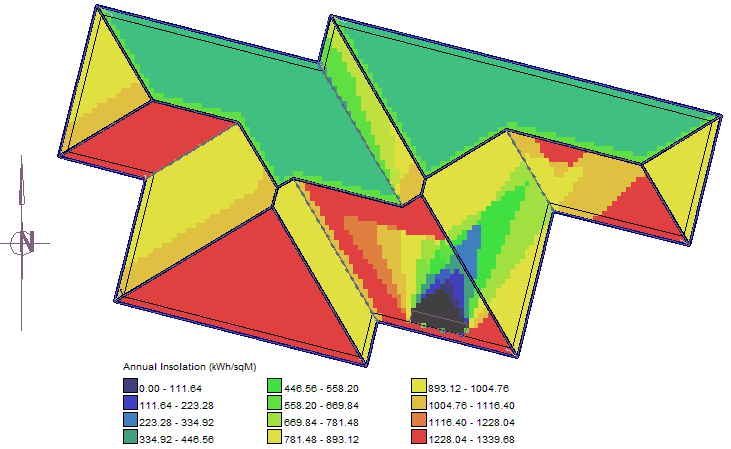
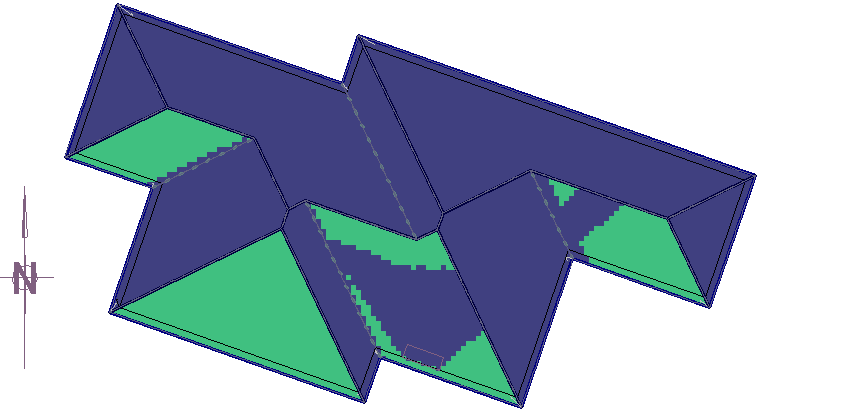
This function allows the operator to create a map of solar radiation that hits the roof planes based on the orientation of each plane to the sun for a range of days and/or times and save the results for later review (to layer 222, although this is automatically controlled) or to be placed in a solar planning report. Any roof fixtures that are added to the roof model such as chimneys and roof penetrations or even adjacent buildings, are also included in the calculation. The operator may add a North Arrow marker in the model area (Solar > North Marker) and if placed to indicate true north, the software automatically rotates the 3D model to orient the roof model to north before the calculation is made.
The application function divides the roof into ‘pixels’ and then displays a colour that indicates the relative intensity of radiation at that pixel. The colour displayed may relate to a value based on values defined by a text file that sets empirical values of radiation based on measurements at that location for days of the year and each hour of the day (see below – Insolation Table). If no Insolation Table is created or selected, the colours simply indicate a relative intensity from zero to one.

Options for different pallets are available so that if the interest is solely in the areas where a shadow is cast, then the colour map ignores the colour intensity range and shows all areas where a shadow would be cast in the time period defined by the operator.
Insolation Calculation Options
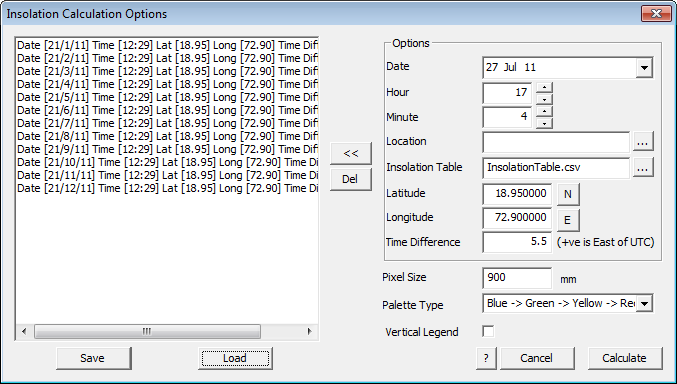
Selecting the option Solar > Generate Insolation Map brings up the Insolation Calculation Options dialog box:
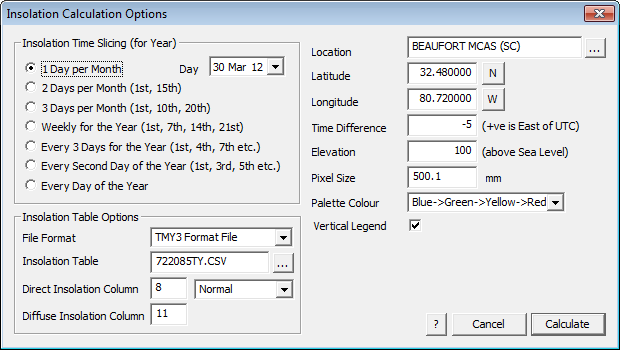
The first thing the software needs is your location. Select your location from the list (Latitude and Longitude and time difference are pre-defined) or define a new location. Define the latitude and longitude for that location and the difference from UTC – Coordinated Universal Time is closely related to Greenwich Mean Time (GMT). Note that daylight saving adjustments are not automatically made.
The location data is defined by selecting the ellipsis button next to location cell on the dialog box. This information is stored in a text file called ‘locations.csv’ located in the …\Roof Wizard\User folder and may be edited in Microsoft Excel and looks like this when opened in MS Excel…

The software is shipped with a default file that includes location data for all primary locations in the USA extracted from NREL measurement locations with USAF reference codes used by the National Climatic Data Center for station identification.
Select/Modify Locations
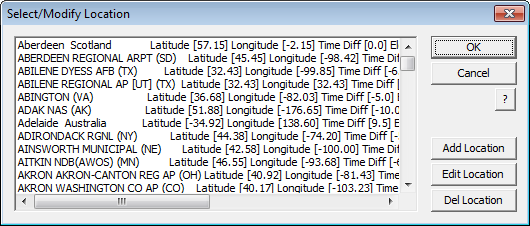
Select the […] button next to the Location field. You may add locations and edit details of locations. Note that longitude Eastings are positive values and Westings are negative values; latitude Northings are positive and Southings are negative.
The next thing to do is plan your insolation/radiation map – decide whether you want the same time on a series of days in a month or the same day each month or a series of hours in a day at say, the winter and summer solstice (the shortest and longest days).
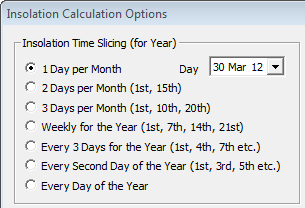
Once this is decided, set your sequence up to give the required results. Typically, you select your date first. For example, if you are preparing a sequence for a particular day, say from sunrise to sunset during the shortest or longest day (June 21 and December 21 respectively).
Time east of Universal Time Coordinated (UTC) are positive and west of UTC are negative.
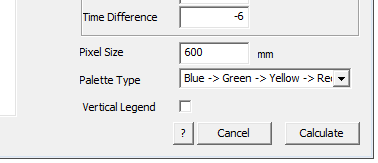
Next define the Pixel Size. This is the size of the square area on the roof plane that will represent the radiation intensity. Big pixels are best to start with as they process quicker. Once you have all the settings as you want them and the result is as you require, then perhaps use a smaller pixel size and rerun the job.
The Palette type allows you to define the colours for the legend for the squares that represents the radiation. Use the Shadow (Grey) palette option if you’re only interested in shadows instead of radiation intensity.
Some preparation ahead of time, setting up the model is assumed at this point. It is assumed that you have added the roof fixtures (panels, AC Units, plumbing vents etc) and perhaps a site base and whatever trees and surrounding structures that are part of the study and that will impact on your calculation. Note that such fixtures must be comprised of plane entities and lines – no curves or ruled surfaces as these do not cast a shadow or block the sun.
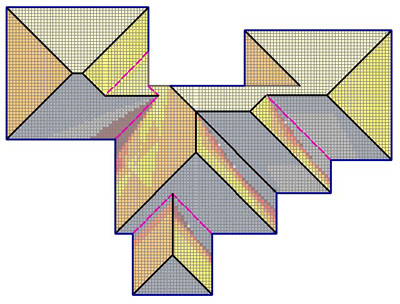
Selecting GrayScale for the palette colour displays the relative insolation levels in gray tones.
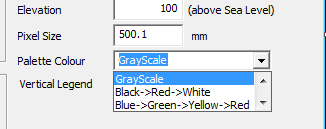
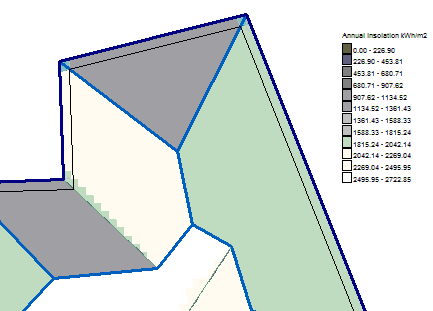
The default layout of the legend for the Insolation map is horizontal. By checking the Vertical Legend box, it will be inserted vertically as shown below.
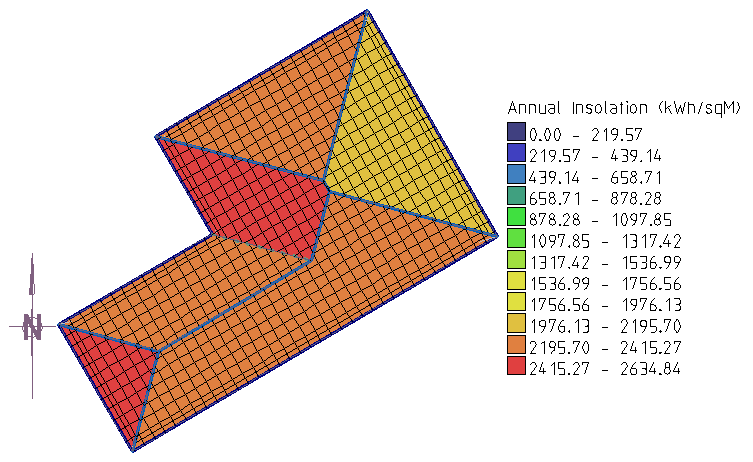
Vertical Legend
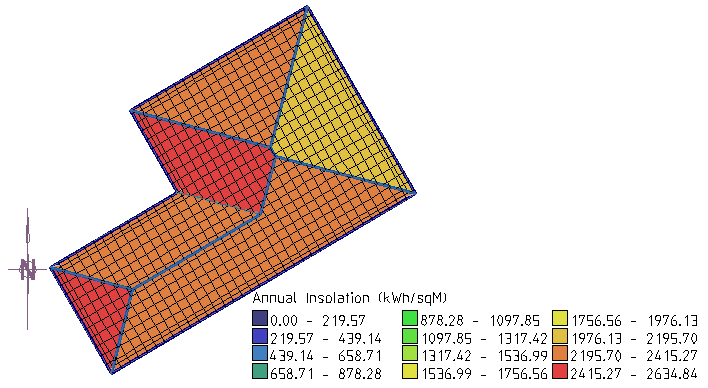
Horizontal Legend
Select the Calculate button, and the operator is prompted to select the planes to calculate the insolation for. This is useful if you have a very large job and only need to calculate the radiation on a small area, or you wish to calculate the radiation just on one or two planes or indeed, individual items such as a panel array.
The software divides the selected planes into squares according to the defined pixel size; takes the data from the file; accounts for the azimuth of the selected planes and calculates the insolation for each pixel and exports it to a csv file called INSOLATION.csv.

As the software proceeds, the prompt area displays the time slice, date and sun position (altitude and azimuth) as each is processed. Depending on the size of the job and the size of the pixels, tis can be very quick or quite slow. You will also notice an arrow is displayed at the origin of the job indicating the position of the sun in the ‘sky’.
The resultant data can be used by the operator to export to external systems for other engineering or accounting tasks to determine the return of investment of a proposed installation.
Solar Yield for your Solar Panels
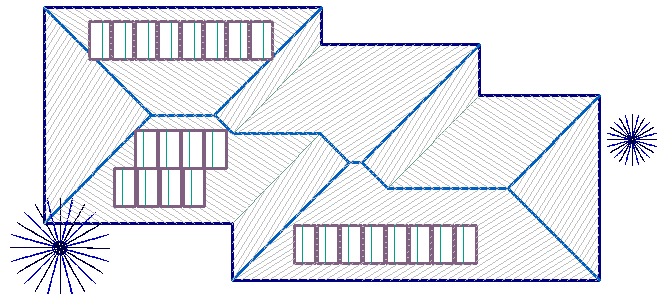
If you wish to calculate the insolation on just your solar panel array (similar to what is shown below), you place the Fixture sub-figure that represents the array onto the preferred location on your roof. Then you must unpack it so that it is accounted for in the calculation. Fixtures and fittings may be added for annotation of the model only – these are not unpacked.
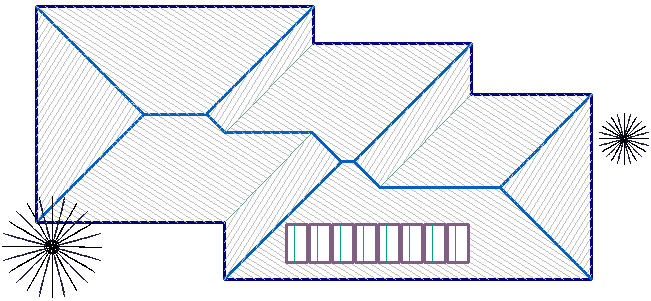
Once unpacked, select the panel surfaces and these will have the insolation calculated for them.
Typically, several locations may be explored to determine the best location for the panels for the best average annual radiation result. Indeed, groups of panels may be located and checked.
Plane ID’s
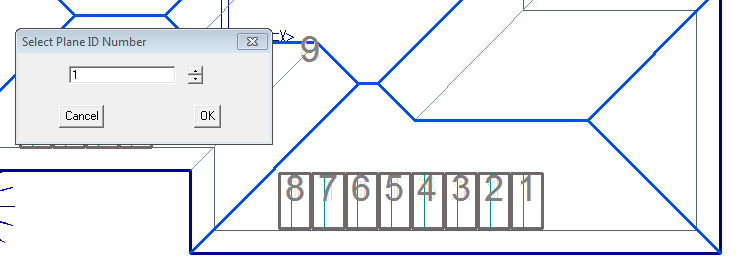
On initial placement of the fixture plane representing the solar panel, each plane is allocated a unique ID number and then when the insolation calculation is done the value is attached to that plane. That would give you the average annual insolation for each plane (which in this case would be a single panel). However, usually we need the sum of the whole array, so we have a tool that groups panels and gives them a single group ID number. This provides the ability to report the array as a single unit.
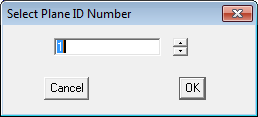
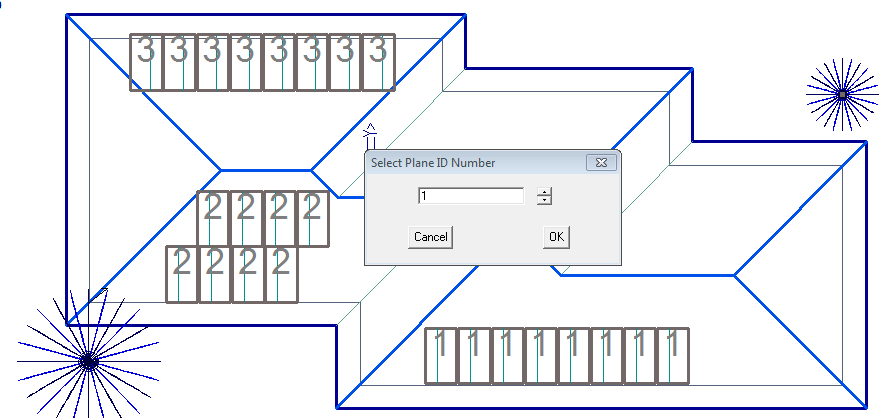
To apply the group ID, select Solar > Insert Plane ID’s and the following dialog box is displayed prompting for the ID number to use for the group.
The current ID numbers are displayed.
Select the plane on each panel and it will change to the defined group ID.
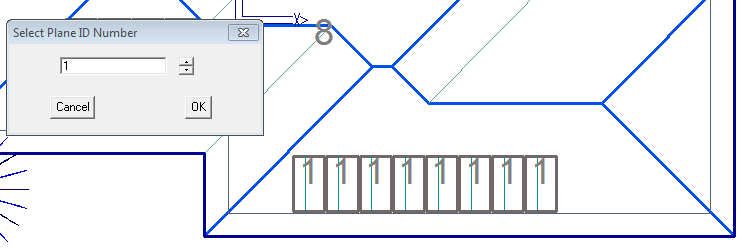
Do this for the rest of the arrays under investigation and then you are ready to generate our insolation map and create the output spreadsheet.
The output spreadsheet file is given the name <database name>-INSOLATION-INSOLCALC.csv
and may be reviewed in Microsoft Excel.
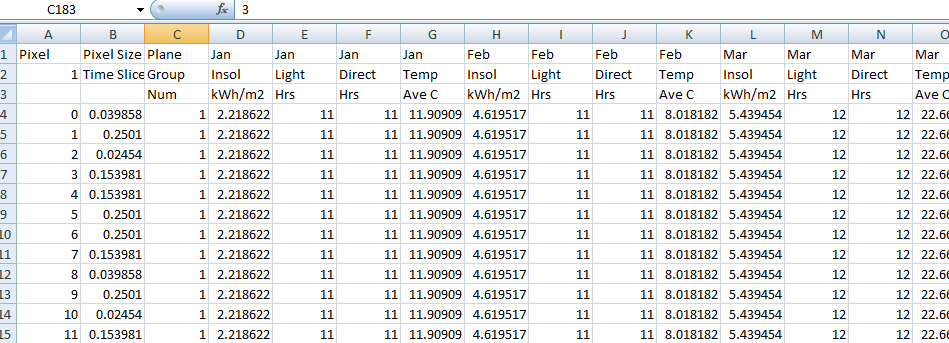
With this data sitting in the …\User folder, you can now annotate the model with Group information. Select Solar > Add-GroupInfo and the following dialog box will be displayed. It provides a powerful tool to modify the appearance of the group box.
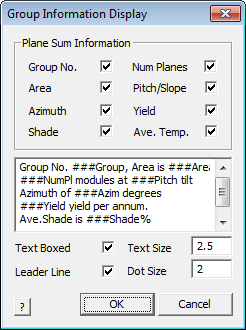
 Group Information Display
Depending on the information selected by checking the available information, the key text string is displayed on the scroll box. You may edit the scroll box to add more descriptive detail – for example ###Group is the key text string placed by the software. Group No. is placed in the box by the operator by clicking in the box and simply typing the required text.
Once defined, this is remembered and saved as a file in the …\User folder as GroupDisplay.dat and may be edited in Notepad.
To apply the information to the roof model, select OK. You will be prompted to select the group to annotate; then prompted to locate the centre of the annotation box; then the start and the end of the leader line.
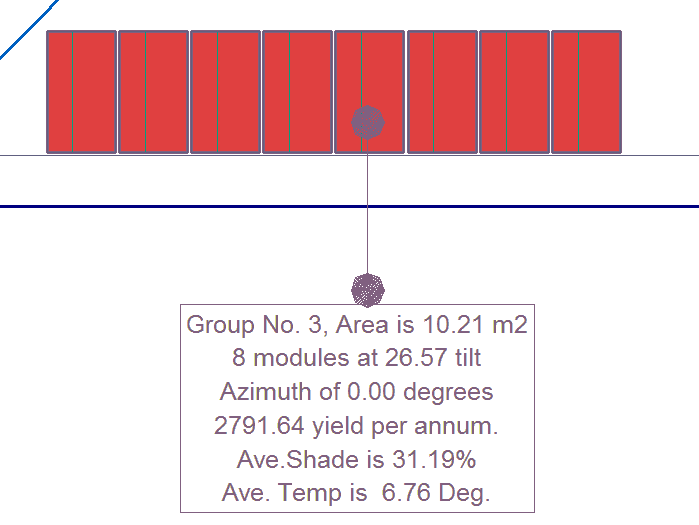
A close up of the Group annotation box may look like this. On the whole job it will look like the image below:
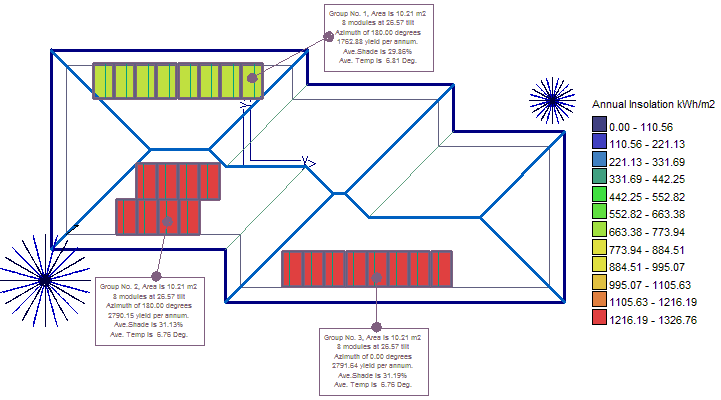
This provides the necessary information to show the client why one location better suits for the placement of the panels. If printed in colour, it also gives a guide to the different levels of insolation around the roof according to the legend.
Insolation Table Options
The operator may use the pre-defined NREL TMY3 data set saved in the TMY3 folder under the folder C:\AppliCad\Roof Wizard\User\TMY3_Data or define their own insolation data table.
If you use the TMY3 data table, you must tell the software which column of data is to be used and whether that data is Direct Normal (DNI) or Diffuse Horizontal (DHI) type data (typically column 8 is DNI and column 11 is DHI). When the NREL TMY3 Table Format is selected as the source, the insolation table used is determined by the file name corresponding to the USAF reference code for the selected location – for example, Beaufort SC is 722085TY.csv. Please refer to the NREL document in the TMY3_Data folder for a detailed explanation of their data set.
The Insolation Table may also be a file that is created by the user, typically using Microsoft Excel or a text editor and saved as a text file in csv (comma separated values file) format. It must be in the form as shown below and would typically cover the range for every hour, day and month. Once created, the values are those values extracted from reliable sources that provide you with the details of the area in question. Multiple files can be created for each region that you require the insolation maps for – for example, InsolationTable-SantaClara.csv. An example is supplied and can be found in the ..\User folder.
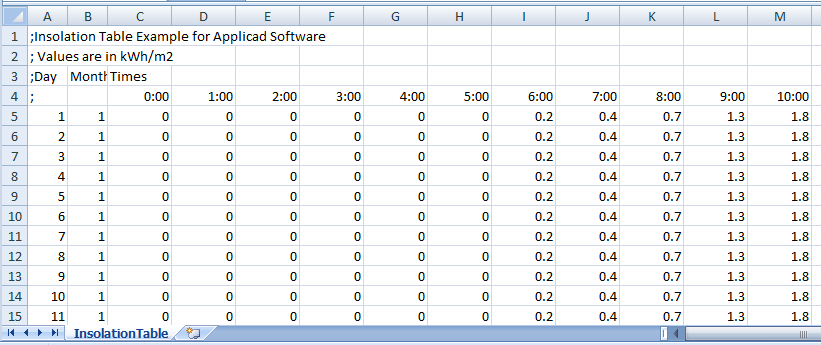
Example of InsolationTable.csv
The value used is the value typically measured and the units are kWh/sqM. The measured value in the table is multiplied by the index value calculated by the software, based on the angle to the sun for any pixel on the roof at that time.
Once defined it can be selected by selecting AppliCad Default Format and the particular file you have defined.
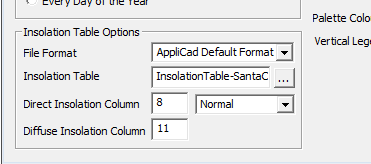

Show/Hide Insolation Map
The Insolation Map may be turned off or on, using the Show/Hide Insolation Map option. The pixel edges may also be turned on or off using the Show/Hide Pixel Edges. It does not delete the map, it simply hides it.
Insert Legend
Allows the operator to insert a legend if that step was missed or not selected when prompted, or to reinsert a legend after deletion. The legend is inserted with the current default settings, so if you need a horizontal legend and the vertical legend was set, then delete the legend and change the default settings and reinsert using this option.
 Rotate Model Back
The function allows the operator to rotate the model and the legend back to the orientation it was before the insolation map or grid was inserted if this step was missed.
Show/Hide Pixel Edges
Turns the insolation map and shadow map edges on or off. It does not delete them. Turning them off can enhance the appearance of the map.
 Delete Insolation Map
Deletes the map and the legend from the model.
 Insert Roof Grid
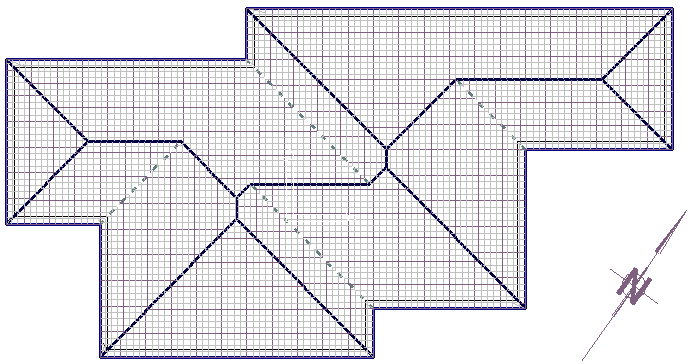
This function inserts an operator defined grid onto the roof planes of the model. This is typically used as a reference grid for site inspections and condition reports for ‘as built’ etc. Having the grid on the roofing report helps with the placement of roof fixtures and penetrations identified during a site visit.
Selecting the option brings up the Grid Options dialog box.
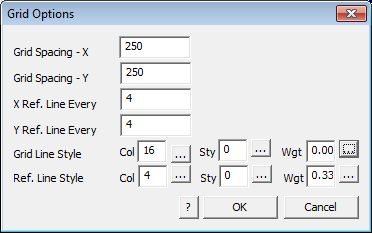
The grid spacing may be defined for the primary grid line and a secondary or reference grid line. Consider the units of measurement when setting these. Each primary or reference grid line may have a different colour, style or weight this helping provide the required emphasis to the grid layout. Experiment with these settings until you get what works best for your situation.
If this is to be used in conjunction with the insolation and shadow calculations, avoid using line colour numbers within the range from 21 to 170 as these will be changed to suit the settings for the calculation and display of relative levels of solar radiation.
 Show/Hide Grid
Turns the Grid on or off. It does not delete the grid.
 Move Grid
Allows the operator to position the start point of a grid to a particular reference point or item on the roof.
 Delete Grid on One Plane
Deletes the grid on just one of the roof planes.
 Delete Grid on All Planes
Deletes the grid from all planes in the roof model.
Add Exclusion Zones
In a solar situation, the Cover > Zones function allows the operator to define areas of a roof where access on the roof is restricted.
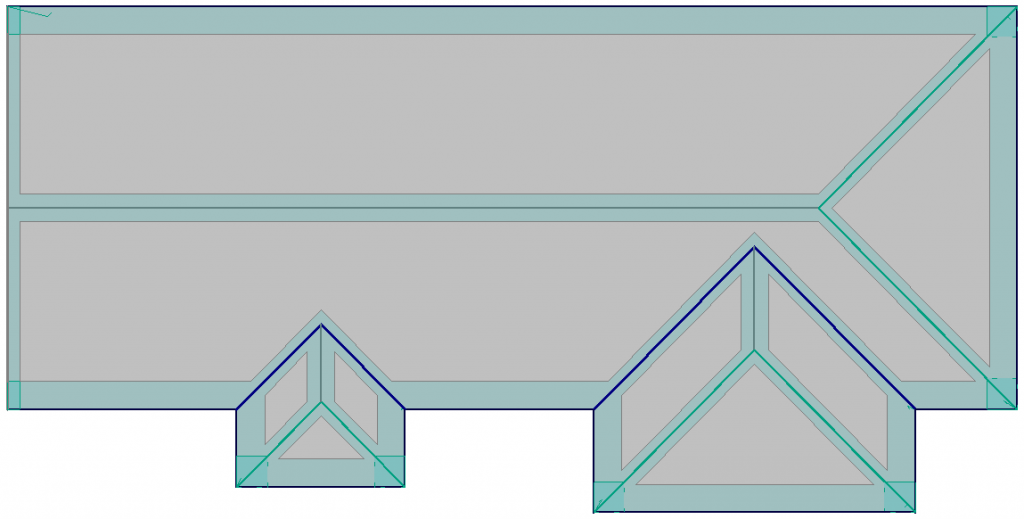
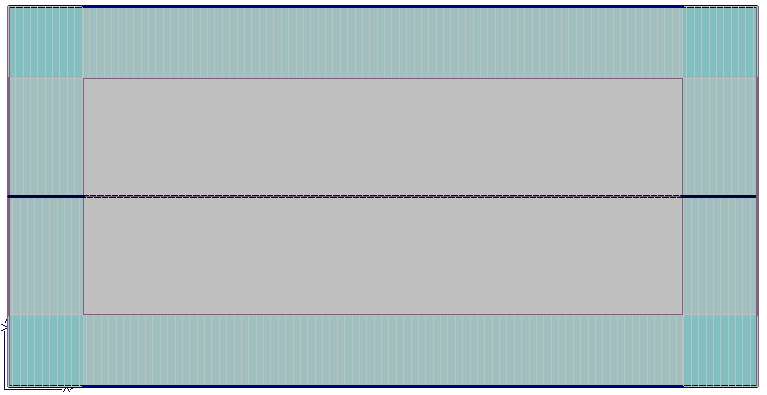
Field Zone, Edge Zone, Corner Zone indicated on the model
The process of adding zones is straight forward and what follows describes the use of Zones for a typical situation.
Model the Roof and Insert Zones
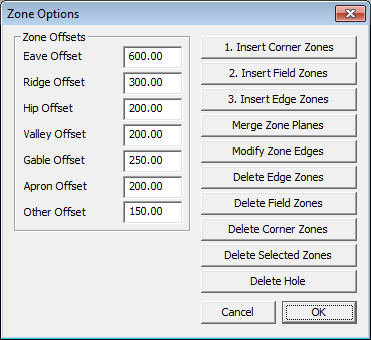
First thing to do is model your roof geometry then select the menu option Cover > Zones. The following dialog box is displayed where you set up the zone offsets or spacing from the specified line types. When inserting the Zones, they must be inserted in the order indicated – that is, Corner Zones, then Field Zones and finally Edge Zones. Note that the lines must have an assignment of type. A ‘None’ line type will not create a zone offset.
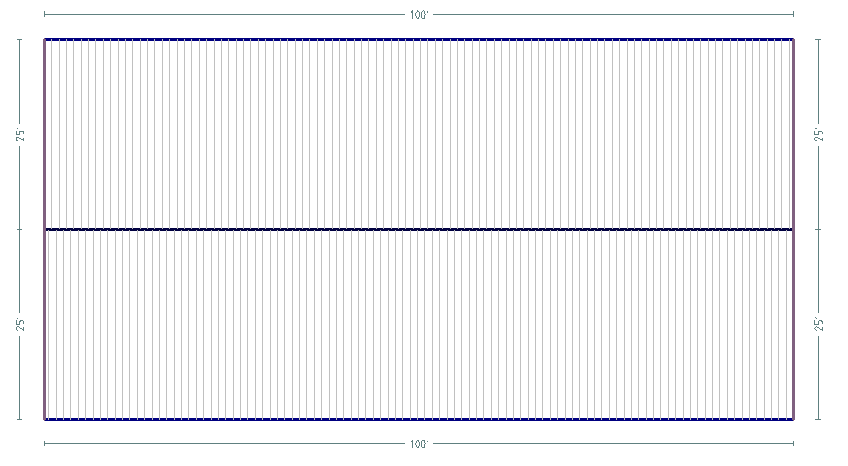
First model the roof geometry.
Select Insert Corner Zone(s) – all zones must be inserted in the order as numbered on the dialog box.
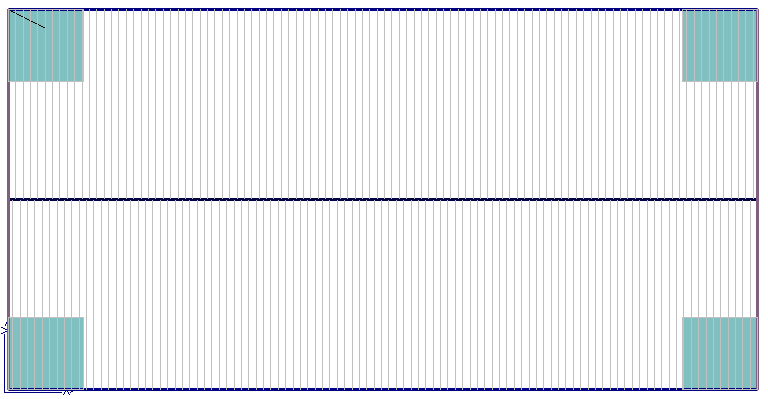
Select Insert Field Zone(s) – the operator is prompted to insert zones on Selected Planes or All Planes.
Field zones are inserted automatically based on Zone Option settings.
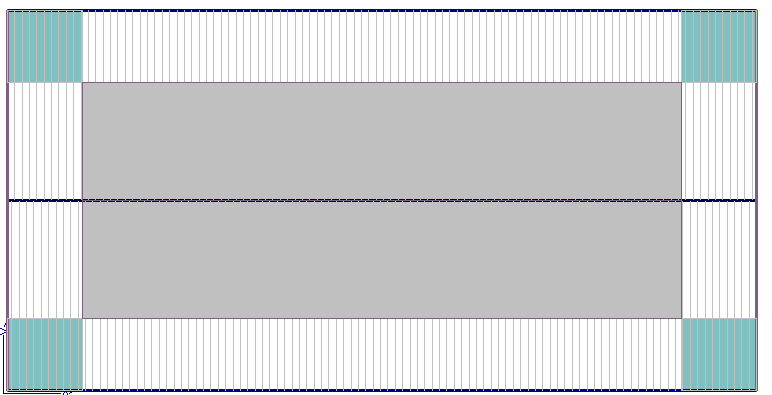
Select Insert Edge Zones and All Planes and the edge zones are inserted.
Using the Insolation Map in Reports
This information is a graphical representation that transfers measured data into a real situation. The more detail added to the model (trees, roof fittings, adjacent buildings etc) the more useful the result.
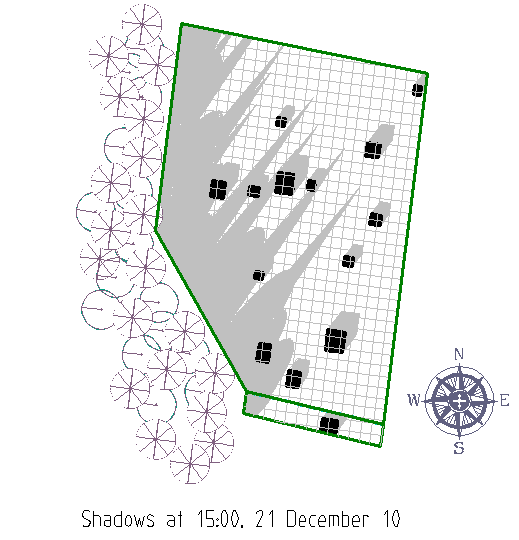
To transfer the information to a custom report requires this model with the Insolation or Shadow map to be saved in the current CAD database as INSOLATION or SHADOWS respectively. Two separate models as shown below.
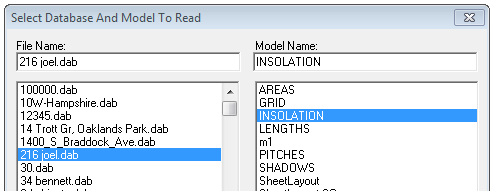
More details about setting up the report template in Microsoft Word is provided in Reporting section of this user help guide.
Render
The Visualisation Render function provides a tool kit for the creation of rendered animated walk-throughs of the 3D model and the transit of shadows across it. The animated walk-through may be generated using wire-frame, hidden line removal or shaded images.
All that is required, in addition to the model to be observed, is a single curve entity that describes the path to be followed. The point-of-view follows along the curve selected. Generally, a Bezier curve is the most adequate curve entity to be used.
The effective real-time replay (play-back) is dependent upon model complexity and systems capabilities. Before creating animation files, ensure you have enough space to store new files. The .avi files you create may be very large in size.
Setting Roof and Wall Textures
Selecting these options prompts the user for a Texture file (in *.TIF or *.BMP format) for applying to the respective planes, representing the material(s) applied to the surfaces. These need to be defined ahead of time and my represent roofing, brickwork, tiles – whatever you need.
If the texture is being applied to a plane, an origin for the image is located, then a location in the X direction, followed by a location in the Y direction. The origin indicates where the ‘tiling’ will begin.
The location of the X direction indicates where the bottom right of the image will be and the location of the Y direction indicates
where the top left of the image will be. Essentially, a grid is created (possibly askew) upon which the image will be placed. All surfaces have a parametric formulation. We call them parametric space co-ordinates (u, v). As u and v vary the surface is drawn. The limits for u and v are 0.0 and 1.0. Effectively, irrespective of the shape of the surface, the surface is mapped to a flat square from (0.0, 0.0) to (1.0, 1.0).
It is from this square that co-ordinates are entered for the three locations. Apart from this mapping, the meanings of the three locations are the same as those for the plane.

For example, to insert a tiled image 5×2 on a surface, use origin (0.0, 0.0), U direction (0.2, 0.0) and V direction (0.0, 0.5). The co-ordinates will need to be typed in at the prompt rather than by selection using the mouse.

Set View
The usual view for a walk-through is the perspective view. A perspective view is defined by two location points and an orientation factor. The view reference location point is specified first. This view reference is the apparent focal point of the perspective, or the point that you are looking at. The eye location point is then specified. This is the apparent standing (or vantage) point of the perspective view. Both of these locations are specified in relation to the currently active CPL.
Finally, the orientation of the perspective is specified. The orientation describes the angular relationship of the eye to the model and is relative to the currently active CPL. The orientation is specified as the locate up ratio of x, y and z. With a Top construction plane selected a ‘locate up’ ratio of 0 0 1 will indicate that the perspective is vertical, relative to the model (i.e. standing upright, eye straight and the z-axis of the -model appears vertically, with positive in an upward direction).
A ratio of 0 1 0 may be used for views looking along the z-axis of the model with the y-axis vertical on the screen. This would give a perspective view of the Top view.
Allows a view to be changed to a perspective view by clicking two points to define the eye-point and reference point.
To create a perspective view:
1 Split the screen so that you have the Top view and the perspective view to be changed on screen.
2 Select the view to be changed.
3 Select the location for the eye-point in the Top view then select the reference point.
The relative distance between these two points determines the size of the model in the view.
Set Lights
This command sets the ambient light source. An Ambient light source determines background lighting. An ambient light source should be specified to ensure that all surfaces have some illumination. The position of this light source has no effect. The use of only one ambient light source is recommended.
Render
This command creates the rendered image file, according to the settings below, and prompts for the output file name.

Output Filename Specifies the output file where the image will be saved. If None is selected, the image will not be saved.
Full screen Specifies whether a full screen image will be calculated or just a part of the screen. If No is selected, the two diagonals of a
rectangle defining the area to be raytraced will be prompted at the time that raytracing is selected.
Anti alias Activates and deactivates anti-aliasing (super-sampling). Antialiasing casts extra rays, (a factor of four) to produce a higher
quality image, the benefits are most obvious around the edges of surfaces. This option takes significantly longer to calculate.
File format Specifies the format of the image file saved. The options are AppliCad, Targa and Image formats. Use the Targa or Image
format if the file is to be used externally from AppliCad in another graphics program.
If AppliCad is selected the output file will be given a .pic file extension. If Targa is selected the output file will be given a .tga file extension. If Image is selected the output file will be given the standard file extension associated with that format.
Dots per ray Specifies the coarseness of the image generated. a value can be entered which equates to the number of screen pixels
representing one ray. Therefore the greater this number, the coarser the image will appear.
The quality is improved by using a smaller number of dots (i.e. ‘1’), but the time taken to produce the image is increased proportionally. It is advisable to do a rough raytrace between four to eight dots, then decrease the number when satisfied.
Maximum ray depth per pixel Specifies the number of surfaces a ray will bounce off during raytracing. This value must be more than one for shadows or reflections to be generated.
Background colour Specifies the colour of the background (i.e. space where rays do not strike a surface. The Select Colour slide bars are enabled. The desired mix of red, green and blue results in the background colour. The RGB boxes display the current colour mix.
Generate bump map file Allows the generation of a Bump-map file. A bump-map is a stored map of the surface normals of a raytraced image.
Bump-map Filename A dialog box is displayed for the selection of an existing file to over write or for the creation of a new file. The bump-map file extension is .bmp and is created when raytracing.
Depth cue Activates and deactivates the depth cue option. With depth cue activated, two new fields are displayed— Depth cue minimum depth and Depth cue maximum depth. When the Depth cue option is selected, the colour intensity of the image is reduced by the depth cue factor of the surface laying between the minimum and maximum depth cues.
Depth cue minimum depth Specifies the minimum depth at which the effect will be evident (i.e. surfaces that are at a distance less than this value from the eye point, will not be reduced by the depth cue factor). Depth cue maximum depth Specifies the maximum depth at which the depth cue effect will be applied. (i.e. surfaces that are at a greater distance from the eye point than this value, will have the background colour allocated).
Fog Activates and deactivates the Fog option. With fog activated, two new fields are displayed, Fog distance and Fog colour. When the fog option is selected, the colour intensity of the calculated image is mixed with the fog colour.
Fog distance Specifies the distance from the eye point at which the fog factor will start to be evident.
Fog colour Specifies the colour of the fog. This colour is mixed with the calculated colours of the surfaces to produce the image. The
select colour slide bars are enabled. The desired mix of red, green and blue results in the fog colour. The RGB boxes display the current colour mix.
Upon confirmation of the dialog box, the raytrace image is generated. The colour of the objects will be determined from the colour option of the entity, together with the colour of the light sources.
The Set Light command must be used to define the light sources before using this command.
Change View
Change View allows you to adjust the eye point for the current perspective view –
Select U(p), D(own), L(eft), R(ight), I(n), O(ut), C(entre).
Change Textures
Allows you to select a different texture for a roof or wall plane.
Change Lights
Allows you to change the ambient light settings.
Manage Textures
The manage textures command allows you to create and manage a library of different textures to create the required effects for your walk-through. Any image of any material can be used. They must be saved in the ..\User folder and be in a TIF format.

Insert World
Inserts a plane to represent the surface of the earth and a hemisphere to represent the sky for visualization purposes. You would apply textures (a sky “texture” and a ground “texture” file so they render realisticially). This is not compulsry, but may make the job look more compelling.
Delete World
Delete World removes the previously placed hemisphere and surface.
Rotate Panel
This function rotates the plane order so that textures orient themselves correctly.

