Solar – Insolation Map/Zones
 Generate Insolation Map
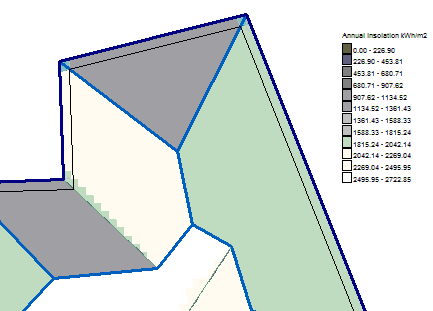
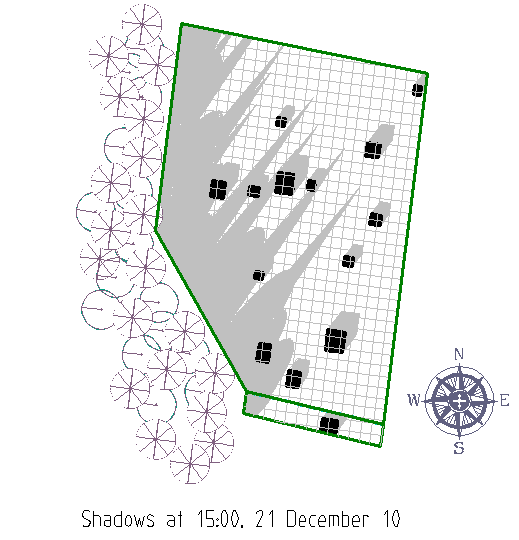
This function allows the operator to create a map of solar radiation that hits the roof planes based on the orientation of each plane to the sun for a range of days and/or times and save the results for later review (to layer 222, although this is automatically controlled) or to be placed in a solar planning report. Any roof fixtures that are added to the roof model such as chimneys and roof penetrations or even adjacent buildings, are also included in the calculation. The operator may add a North Arrow marker in the model area (Solar > North Marker) and if placed to indicate true north, the software automatically rotates the 3D model to orient the roof model to north before the calculation is made.
The application function divides the roof into ‘pixels’ and then displays a colour that indicates the relative intensity of radiation at that pixel. The colour displayed may relate to a value based on values defined by a text file that sets empirical values of radiation based on measurements at that location for days of the year and each hour of the day (see below – Insolation Table). If no Insolation Table is created or selected, the colours simply indicate a relative intensity from zero to one.
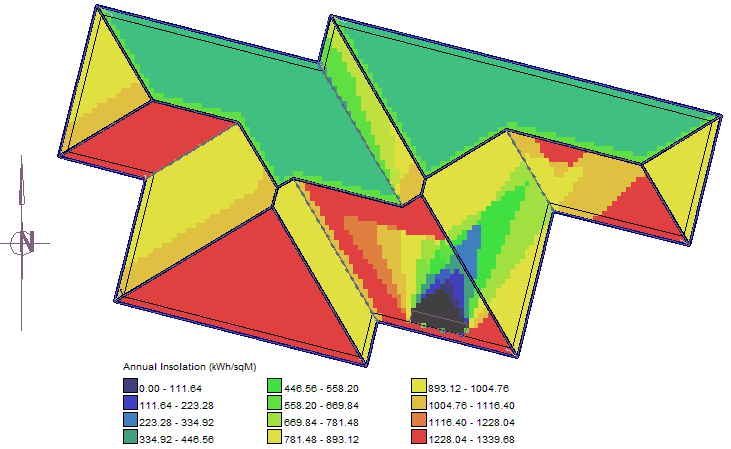
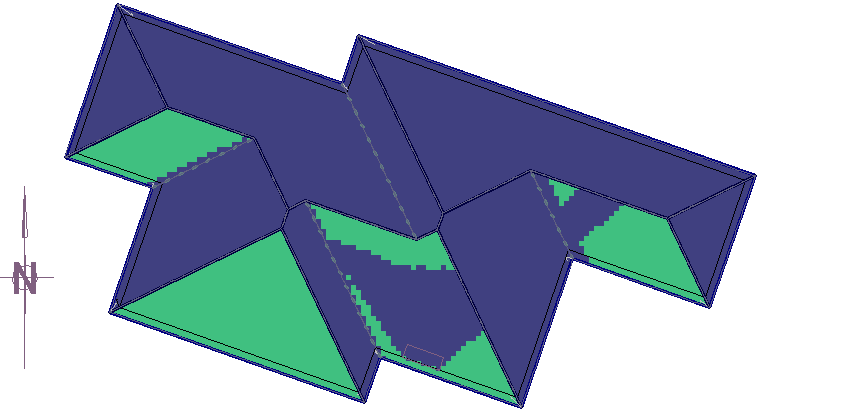
Options for different pallets are available so that if the interest is solely in the areas where a shadow is cast, then the colour map ignores the colour intensity range and shows all areas where a shadow would be cast in the time period defined by the operator.
Insolation Calculation Options
Selecting the option Solar > Generate Insolation Map brings up the Insolation Calculation Options dialog box:
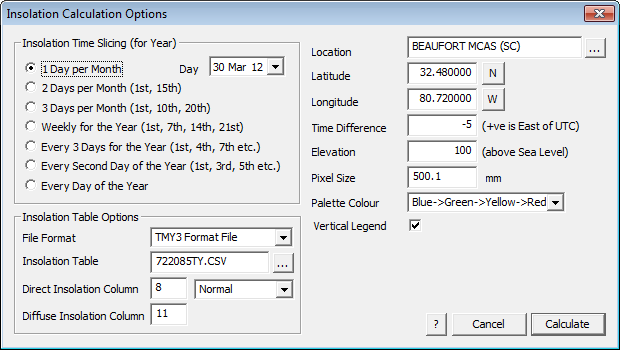
The first thing the software needs is your location. Select your location from the list (Latitude and Longitude and time difference are pre-defined) or define a new location. Define the latitude and longitude for that location and the difference from UTC – Coordinated Universal Time is closely related to Greenwich Mean Time (GMT). Note that daylight saving adjustments are not automatically made.
The location data is defined by selecting the ellipsis button next to location cell on the dialog box. This information is stored in a text file called ‘locations.csv’ located in the …\Roof Wizard\User folder and may be edited in Microsoft Excel and looks like this when opened in MS Excel…
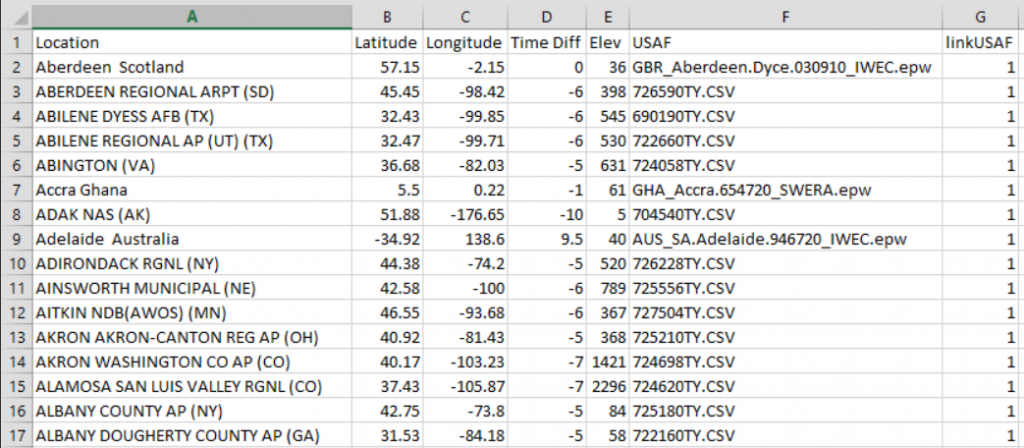
The software is shipped with a default file that includes location data for all primary locations in the USA extracted from NREL measurement locations with USAF reference codes used by the National Climatic Data Center for station identification.
Select/Modify Locations
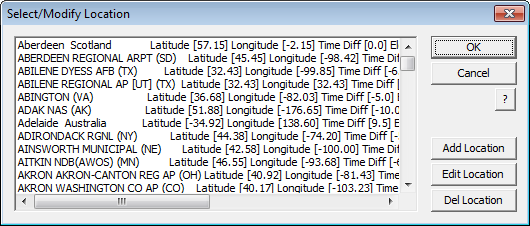
Select the […] button next to the Location field. You may add locations and edit details of locations. Note that longitude Eastings are positive values and Westings are negative values; latitude Northings are positive and Southings are negative.
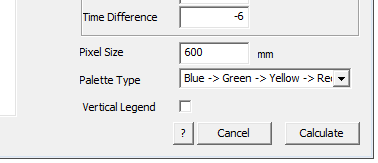
The next thing to do is plan your insolation/radiation map – decide whether you want the same time on a series of days in a month or the same day each month or a series of hours in a day at say, the winter and summer solstice (the shortest and longest days).
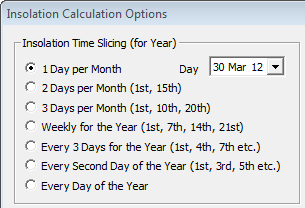
Once this is decided, set your sequence up to give the required results. Typically, you select your date first. For example, if you are preparing a sequence for a particular day, say from sunrise to sunset during the shortest or longest day (June 21 and December 21 respectively).
Time east of Universal Time Coordinated (UTC) are positive and west of UTC are negative.
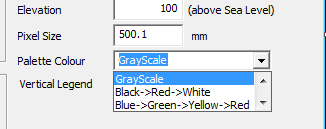
Next define the Pixel Size. This is the size of the square area on the roof plane that will represent the radiation intensity. Big pixels are best to start with as they process quicker. Once you have all the settings as you want them and the result is as you require, then perhaps use a smaller pixel size and rerun the job.
The Palette type allows you to define the colours for the legend for the squares that represents the radiation. Use the Shadow (Grey) palette option if you’re only interested in shadows instead of radiation intensity.
Some preparation ahead of time, setting up the model is assumed at this point. It is assumed that you have added the roof fixtures (panels, AC Units, plumbing vents etc) and perhaps a site base and whatever trees and surrounding structures that are part of the study and that will impact on your calculation. Note that such fixtures must be comprised of plane entities and lines – no curves or ruled surfaces as these do not cast a shadow or block the sun.
Selecting GrayScale for the palette colour displays the relative insolation levels in gray tones.
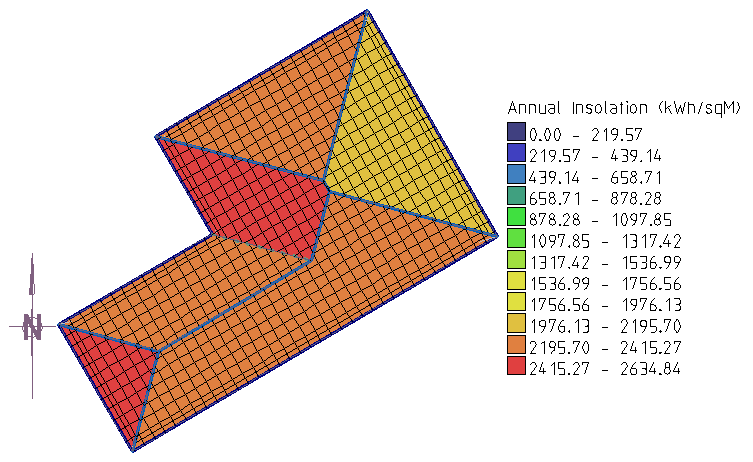
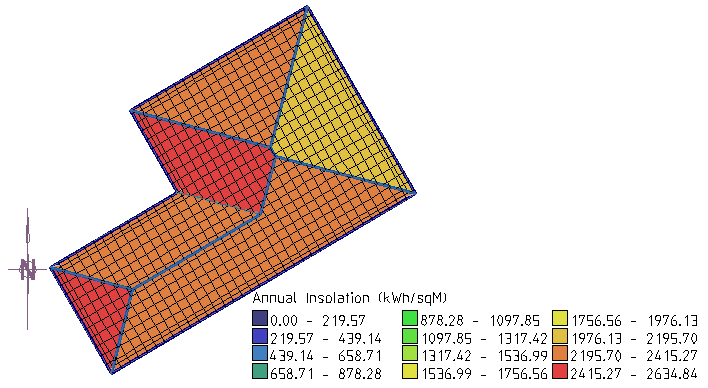
The default layout of the legend for the Insolation map is horizontal. By checking the Vertical Legend box, it will be inserted vertically as shown below.
Vertical Legend
Horizontal Legend
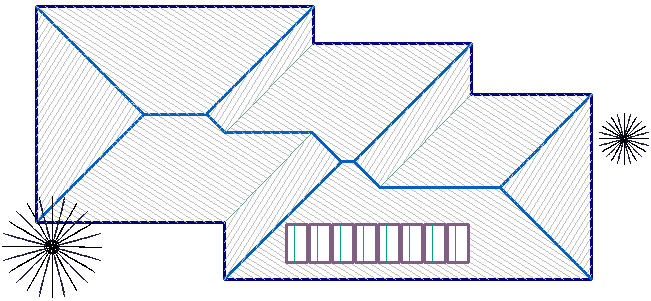
Select the Calculate button, and the operator is prompted to select the planes to calculate the insolation for. This is useful if you have a very large job and only need to calculate the radiation on a small area, or you wish to calculate the radiation just on one or two planes or indeed, individual items such as a panel array.
The software divides the selected planes into squares according to the defined pixel size; takes the data from the file; accounts for the azimuth of the selected planes and calculates the insolation for each pixel and exports it to a csv file called INSOLATION.csv.
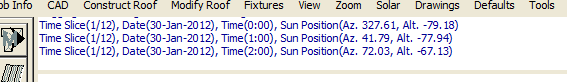
As the software proceeds, the prompt area displays the time slice, date and sun position (altitude and azimuth) as each is processed. Depending on the size of the job and the size of the pixels, tis can be very quick or quite slow. You will also notice an arrow is displayed at the origin of the job indicating the position of the sun in the ‘sky’.
The resultant data can be used by the operator to export to external systems for other engineering or accounting tasks to determine the return of investment of a proposed installation.
Solar Yield for your Solar Panels
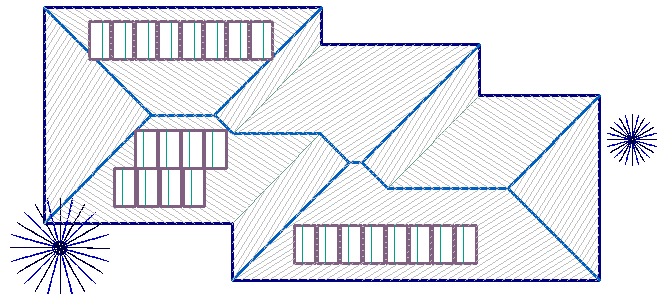
If you wish to calculate the insolation on just your solar panel array (similar to what is shown below), you place the Fixture sub-figure that represents the array onto the preferred location on your roof. Then you must unpack it so that it is accounted for in the calculation. Fixtures and fittings may be added for annotation of the model only – these are not unpacked.
Once unpacked, select the panel surfaces and these will have the insolation calculated for them.
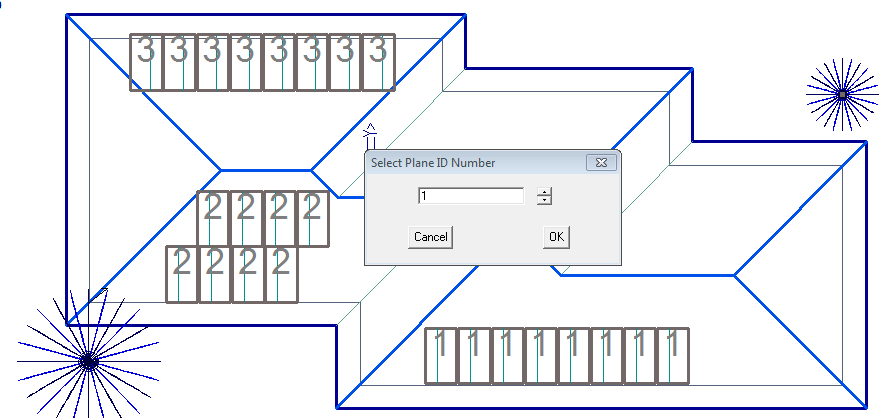
Typically, several locations may be explored to determine the best location for the panels for the best average annual radiation result.
Indeed, groups of panels may be located and checked.
On initial placement each plane is allocated a unique ID number and then when the insolation calculation is done the value is attached to that plane. That would give you the average annual insolation for each plane (which in this case would be a single panel). However, usually we need the sum of the whole array, so we have a tool that groups panels and gives them a single group ID number. This provides the ability to report the array as a single unit.
To apply the group ID, select Solar > Insert Plane ID’s and the following dialog box is displayed prompting for the ID number to use for the group.
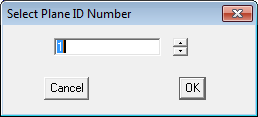
The current ID numbers are displayed.
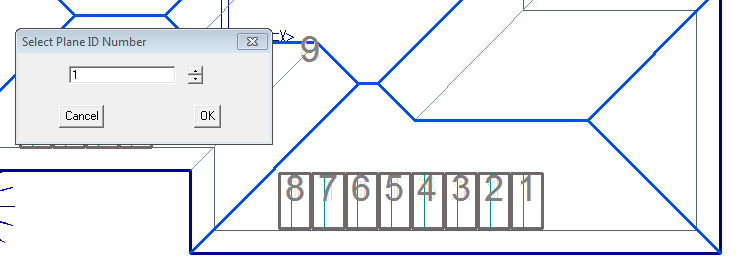
Select the plane on each panel and it will change to the defined group ID.
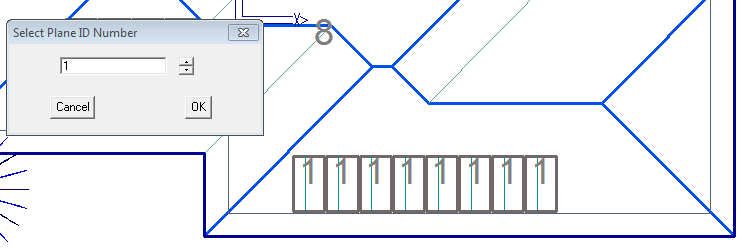
Do this for the rest of the arrays under investigation and then you are ready to generate our insolation map and create the output spreadsheet.
The output spreadsheet file is given the name <database name>-INSOLATION-INSOLCALC.csv
and may be reviewed in Microsoft Excel.
With this data sitting in the …\User folder, you can now annotate the model with Group information. Select Solar > Add-GroupInfo and the following dialog box will be displayed. It provides a powerful tool to modify the appearance of the group box.
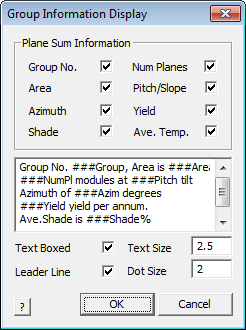
Group Information Display
Depending on the information selected by checking the available information, the key text string is displayed on the scroll box. You may edit the scroll box to add more descriptive detail – for example ###Group is the key text string placed by the software. Group No. is placed in the box by the operator by clicking in the box and simply typing the required text.
Once defined, this is remembered and saved as a file in the …\User folder as GroupDisplay.dat and may be edited in Notepad.
To apply the information to the roof model, select OK. You will be prompted to select the group to annotate; then prompted to locate the centre of the annotation box; then the start and the end of the leader line.
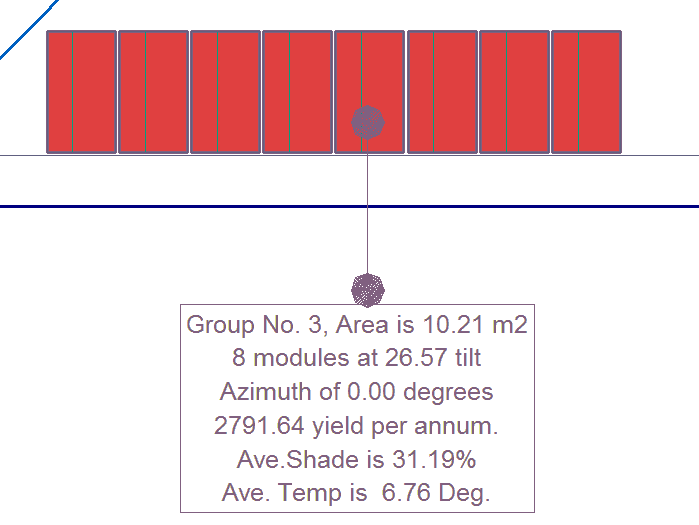
A close up of the Group annotation box may look like this. On the whole job it will look like the image below:
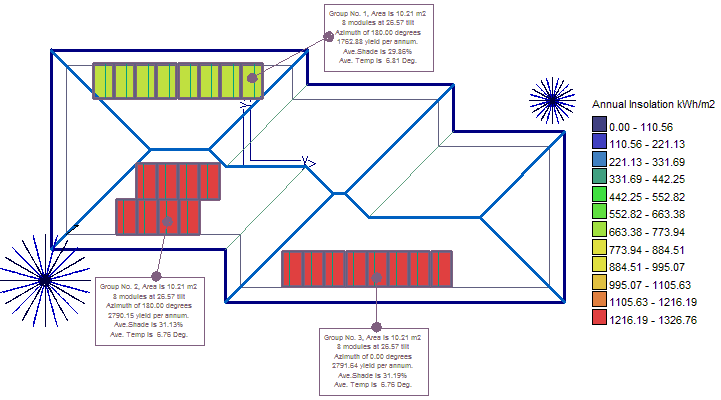
This provides the necessary information to show the client why one location better suits for the placement of the panels. If printed in colour, it also gives a guide to the different levels of insolation around the roof according to the legend.
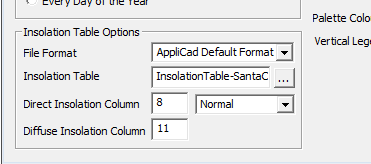
Insolation Table Options
The operator may use the pre-defined NREL TMY3 data set saved in the TMY3 folder under the folder C:\AppliCad\Roof Wizard\User\TMY3_Data or define their own insolation data table.
If you use the TMY3 data table, you must tell the software which column of data is to be used and whether that data is Direct Normal (DNI) or Diffuse Horizontal (DHI) type data (typically column 8 is DNI and column 11 is DHI). When the NREL TMY3 Table Format is selected as the source, the insolation table used is determined by the file name corresponding to the USAF reference code for the selected location – for example, Beaufort SC is 722085TY.csv. Please refer to the NREL document in the TMY3_Data folder for a detailed explanation of their data set.
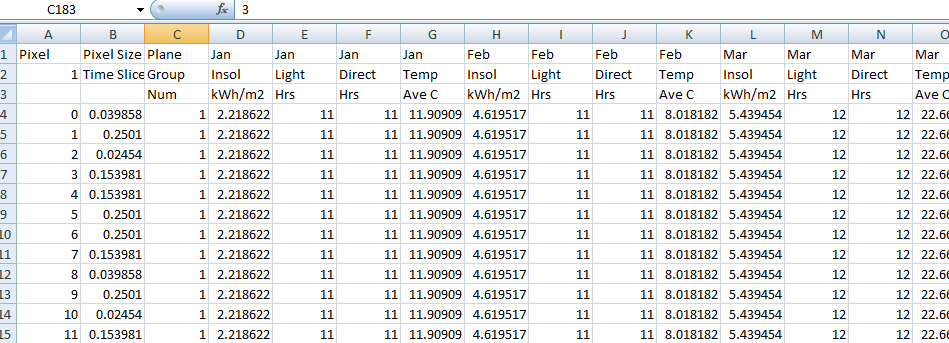
The Insolation Table may also be a file that is created by the user, typically using Microsoft Excel or a text editor and saved as a text file in csv (comma separated values file) format. It must be in the form as shown below and would typically cover the range for every hour, day and month. Once created, the values are those values extracted from reliable sources that provide you with the details of the area in question. Multiple files can be created for each region that you require the insolation maps for – for example, InsolationTable-SantaClara.csv. An example is supplied and can be found in the ..\User folder.
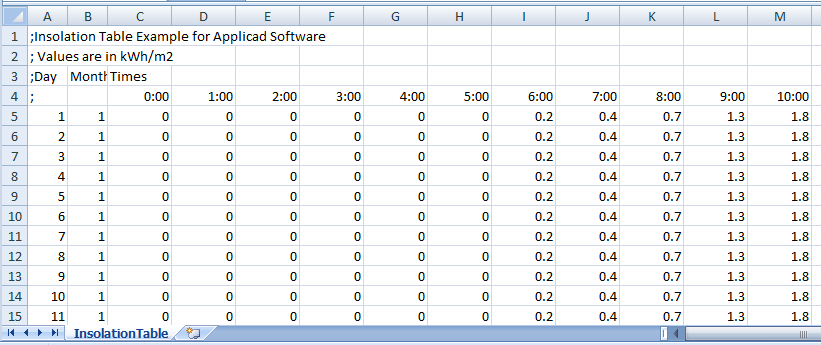
Example of InsolationTable.csv
The value used is the value typically measured and the units are kWh/sqM. The measured value in the table is multiplied by the index value calculated by the software, based on the angle to the sun for any pixel on the roof at that time.
Once defined it can be selected by selecting AppliCad Default Format and the particular file you have defined.
Show/Hide Insolation Map
The Insolation Map may be turned off or on, using the Show/Hide Insolation Map option. The pixel edges may also be turned on or off using the Show/Hide Pixel Edges. It does not delete the map, it simply hides it.
Insert Legend
Allows the operator to insert a legend if that step was missed or not selected when prompted, or to reinsert a legend after deletion. The legend is inserted with the current default settings, so if you need a horizontal legend and the vertical legend was set, then delete the legend and change the default settings and reinsert using this option.
Rotate Model Back
The function allows the operator to rotate the model and the legend back to the orientation it was before the insolation map or grid was inserted if this step was missed.
Show/Hide Insolation Map
Turns the insolation map or shadow map on or off. It does not delete it.
Show/Hide Pixel Edges
Turns the insolation map and shadow map edges on or off. It does not delete them. Turning them off can enhance the appearance of the map.
Delete Insolation Map
Deletes the map and the legend from the model.
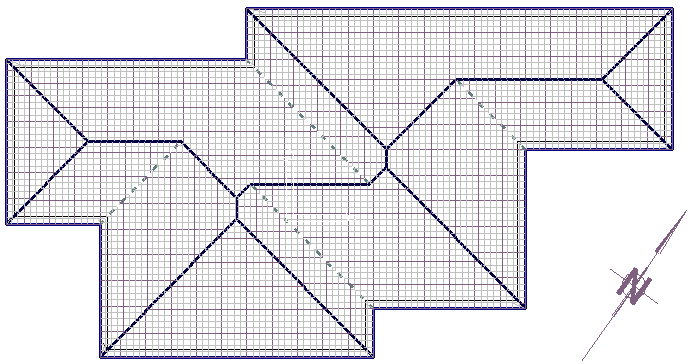
Insert Roof Grid
This function inserts an operator defined grid onto the roof planes of the model. This is typically used as a reference grid for site inspections and condition reports for ‘as built’ etc. Having the grid on the roofing report helps with the placement of roof fixtures and penetrations identified during a site visit.
Selecting the option brings up the Grid Options dialog box.
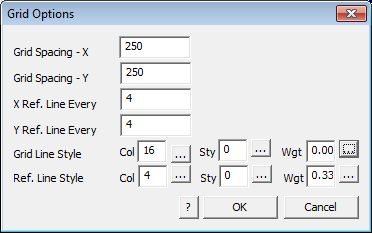
The grid spacing may be defined for the primary grid line and a secondary or reference grid line. Consider the units of measurement when setting these. Each primary or reference grid line may have a different colour, style or weight this helping provide the required emphasis to the grid layout. Experiment with these settings until you get what works best for your situation.
If this is to be used in conjunction with the insolation and shadow calculations, avoid using line colour numbers within the range from 21 to 170 as these will be changed to suit the settings for the calculation and display of relative levels of solar radiation.
Show/Hide Grid
Turns the Grid on or off. It does not delete the grid.
Move Grid
Allows the operator to position the start point of a grid to a particular reference point or item on the roof.
Delete Grid on One Plane
Deletes the grid on just one of the roof planes.
Delete Grid on All Planes
Deletes the grid from all planes in the roof model.
Add Exclusion Zones
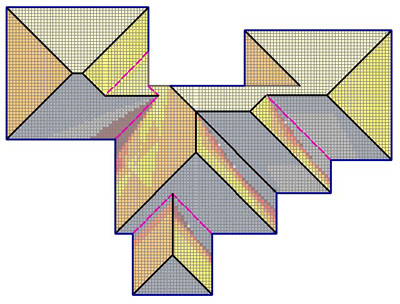
In a solar situation, the Zones function allows the operator to define areas of a roof where access on the roof is restricted.
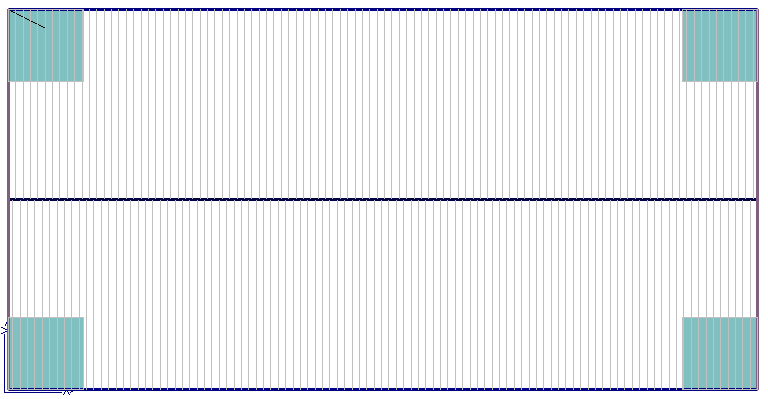
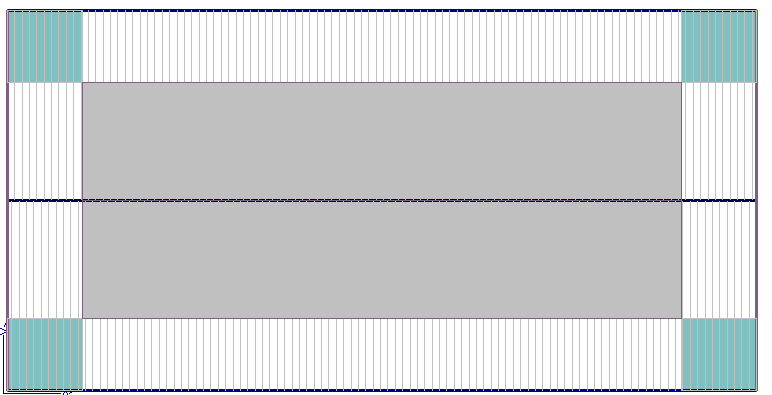
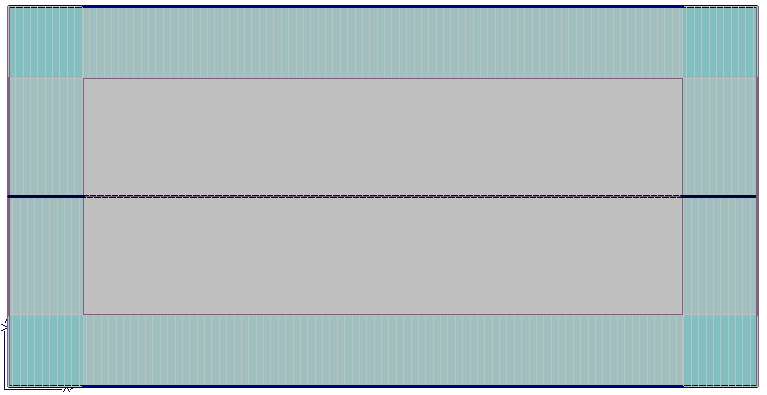
Field Zone, Edge Zone, Corner Zone indicated on the model
The process of adding zones is straight forward and what follows describes the use of Zones for a typical situation.
Model the Roof and Insert Zones
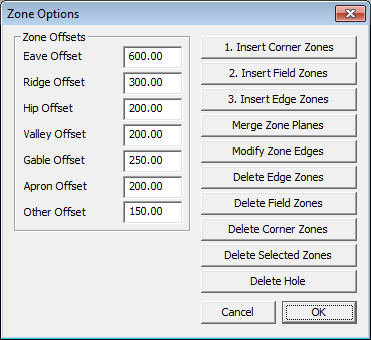
First thing to do is model your roof geometry then select the menu option Cover > Zones. The following dialog box is displayed where you set up the zone offsets or spacing from the specified line types. When inserting the Zones, they must be inserted in the order indicated – that is, Corner Zones, then Field Zones and finally Edge Zones. Note that the lines must have an assignment of type. A ‘None’ line type will not create a zone offset.
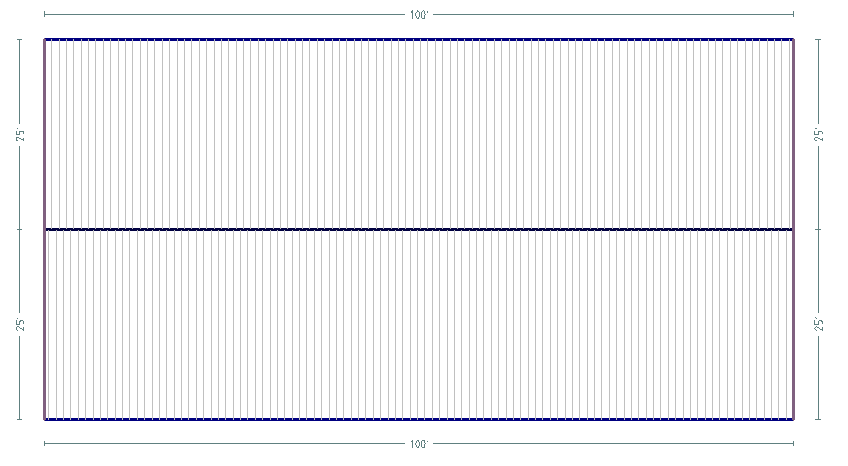
First model the roof geometry.
Select Insert Corner Zone(s) – all zones must be inserted in the order as numbered on the dialog box.
Select Insert Field Zone(s) – the operator is prompted to insert zones on Selected Planes or All Planes.
Field zones are inserted automatically based on Zone Option settings.
Select Insert Edge Zones and All Planes and the edge zones are inserted.
Using the Insolation Map in Reports
This information is a graphical representation that transfers measured data into a real situation. The more detail added to the model (trees, roof fittings, adjacent buildings etc) the more useful the result.
To transfer the information to a custom report requires this model with the Insolation or Shadow map to be saved in the current CAD database as INSOLATION or SHADOWS respectively. Two separate models as shown below.
More details about setting up the report template in Microsoft Word is provided in Reporting section of this user guide.
Comments are closed.